Department of Public Administration
and national security
Modern
strategic analysis
Surma I.V.
Associate Professor, Ph.D., Member of the Expert Council
Committee on financial market State Duma of the Russian Federation
Moscow
2013Strategic planning:
main stages and tools
"Knowledge of some
principles easily compensates
ignorance of certain facts.
Claude Helvetius Main stages:
1. Determining the global purpose of the organization
(missions);
2. Defining the goals of the organization;
3. Evaluation and analysis external environment organizations;
4. Identification of strengths and weaknesses
organizations;
5. Analysis of strategic alternatives;
6. Choice of strategy;
7. Implementation of the strategy;
8. Evaluation of the results of implementation
strategies. Step #1. Define the global
organization goals (missions)
The mission of an organization (institution) is a statement
philosophy, the definition of the meaning of its existence, needs,
which it seeks to satisfy, the choice of niche and market segment,
identification of consumers, ways to satisfy them
needs, that is, a formulated global goal,
explaining why and for what reason it was created and functions
this organization(institution).
A well-defined mission should
to be a source of team unity,
guide for management, serve as a guide for
selection of benchmark goals and strategic
alternatives, link goals
into a single target tree.
Target Tree Decomposition Method (Option #1)
Goal level
Characteristic
Target level "0"
global goal
organizations
Target level "1"
The purpose of the main subsystems and
control system
Target level "2"
Goals defined
appointment of each
subsystems
Target level "3"
Goals initiated
line of business
Target Level "4"
Implementation activities
goals
Example Step #2: Determining the goals of the organization
Target Tree Decomposition Method (Option #2)
Mission of the organization (institution)
Goals initiated by the environment of the organization (institution)
macro environment
Microenvironment
Internal environment
Directions of activity of the management of the organization (institution)
Most Relevant
macro-environment factors
Most Relevant
microenvironment factors
Most Relevant
internal environment factors
Activities planned by the management of the organization (institution)
Towards
Towards
Towards
macro environment
microenvironments
internal environment
Tasks implemented by the management of the organization (institution)
For each event
For each event
For each event
PEST analysis of the macro environment
PEST-analysis - by the first letters of English words: Political - political and legal aspect; economic -
economic aspect; Sociocultural - sociocultural; Technological - technological aspect.
Positive aspects
Negative aspects
Political and legal factors: political stability, educational legislation,
trade union activity, etc.
Economic factors: tax policy, inflation rate, level of wages V
education, wage system, etc.
Socio-cultural factors: demographic situation, population mobility, lifestyle.
Technological factors: innovative technologies, intellectual property protection. Stage number 3. Assessment and analysis of the external environment of the organization
Matrix of Opportunities and Threats
Probability
use
possibilities
Influence on the strategy of the organization (institution)
strong
Moderate
small
high
Field "Sun"
Field "VU"
Field "VM"
Medium
Field "SS"
Field "SU"
Field "SM"
Low
Field "NS"
Field "NU"
Field "HM" Stage number 4. Identification of strengths and
organization's weaknesses
SWOT analysis
Internal environment
organizations
(institutions).
Potential assessment
Forces ("S"):
1. _______________
2. _______________
Weaknesses ("W"):
1. _______________
2. _______________
External environment of the organization (institution)
Features ("O"):
1. ______________
2. ______________
Threats ("T"):
1. ______________
2. ______________
1. SO field
II. Field "ST"
IV. WO field
III. Field "WT" SWOT - a method of analysis in a strategic
planning, which consists in dividing
factors and phenomena into four categories: Strengths
(Strengths), Weaknesses (Weaknesses),
Opportunities (Opportunities) and Threats (Threats).
SWOT was first introduced in 1963 at Harvard
conferences on business policy problems by professor
K.Andrews. The original SWOT analysis was based on
voicing and structuring knowledge about current situation And
trends.
IN
1965
year
four
professors
Harvard
University - Leraned, Christensen, Andrews, Guth
proposed technology using SWOT models for
developing a strategy for the company's behavior. Was proposed
LCAG scheme (by initial letters of authors' surnames),
which
founded
on
sequences
steps
leading to the choice of strategy.
Since SWOT analysis in general does not contain
economic categories, it can be applied to any
organizations individual people and countries to build
strategies in the most various areas activities. SNW analysis is an analysis of the weak and
strengths of the organization, assessed
internal environment by three values:
Strength (strong side),
Neutral (neutral side),
Weakness (weak side).
As practice has shown, in a situation
strategic analysis of the internal environment
organization as a neutral position is better
just fix the average market state for
this particular situation.
Usually SNW analysis is used for more
in-depth study of the internal environment of the company after
conducting a SWOT analysis. SNW analysis example
N
p/n
Qualitative assessment of the position
strategic position
1.
Corporate
strategy
2.
Business strategy (or
business unit strategy) including
including:
Business 1
Business 2
3.
organizational structure
4.
Finance as a general
financial position,
including:
Finance as a state
current balance
Finance as a financial structure
Finance as investment
resources
S
N
W
strong
Neutral
Weak
Strategic SWOT Analysis Matrix
FavorableStrategic Matrix
SWOT analysis
OPPORTUNITIES - Opportunities
Key Success Factors
(KFU)
unfavorable
GRADE
STRENGTHS - Forces
Competitive advantages
(Key competencies)
Strategic
alternatives
THREATS - Threats
(Threats from the external environment)
WEAKNESSES - Weaknesses
(firm weaknesses) STRENGTHS - competitive advantages
Company reliability
Low cost of services
Highly professional control system
Experience in attracting and retaining customers
Concentration on certain products and services
Individual customer service
Access to financial resources (preferably "long")
Advanced Information Technology
Professional staff
Dynamic response to market changes
High quality service
Effective communication with local authorities authorities
Brand fame
good location WEAKNESSES - weaknesses
Does not have a professional system
management
Not driven by customer needs
Doesn't track competitors
Doesn't understand what clients he is targeting
Does not innovate business
Does not conduct market research
Does not highlight or improve business processes
Not making enough development efforts
brand
Does not use new technologies
Doesn't train staff
Does not identify or predict risks, etc. OPPORTUNITIES - key success factors (KSF) favorable circumstances, use
which will create an advantage
Improving the investment climate in
country
Deteriorating position of competitors
Reducing inflation
Strengthening of the ruble against
dollar
Underdeveloped species
service
A sharp increase in demand for certain types
products and services
Income growth of the population, etc. TREATS - Threats
(factors that could potentially worsen
position)
lack of capital
Limited resource base
Entering the market of new
competitors
Changing preferences
clients
Increasing taxes, etc.
SWOT analysis
To concretizestrategic
SWOT analysis optional
build two more matrices:
Opportunity Matrix
Threat Matrix Opportunity Matrix
Influence
strong
Average
Weak
Probability
high
1
2
3
Medium
4
5
6
Low
7
8
9Threat Matrix
Influence Collapse
heavy
state
Middle
gravity
Lung
Probability
high
1
2
3
4
Medium
5
6
7
8
Low
9
10
11
12
When conducting a SWOT analysis, various methods are used:
situational analysis using,desk and field research
Development of analytical maps based on
expert assessments ("brainstorming" or
free association method, Delphi method,
synectics, etc.)
Assessment of strengths and weaknesses in comparison with
main competitors.
Positioning through focus groups, questionnaires, etc.
Formulating strategic goals and strategic alternatives
Strategic alternatives and goalscompanies are determined after
formulating the Mission, Vision and implementation
SWOT analysis.
Goals show what the company is striving for
and what she wants to achieve.
The goals of the company are carefully
analysis and are divided into long-term,
medium and short term and usually
presented in the form of an ordered
goal tree.
SMART - the principle Goals must satisfy several prerequisites
They should be:specific
measured (Measurable)
agreed (Agreeable or Accordant):
- with the Vision and Mission of the company,
- between themselves,
- with those who have to fulfill them;
achievable (Realistic)
defined in time (Time bound)
alternatives
G.N. business screen Konstantinov
The attractiveness of this
strategies
high
Competitive position of this alternative
strong
Medium
Weak
"Star"
"Wild cat"
"Milk
cow"
"Dog"
Medium
Low
"Star" - a strategy that is as attractive and competitive as possible;
"Wild cat" - the strategy is attractive, but no longer competitive;
"Cash cow" - the strategy is no longer attractive, but still competitive;
"Dog" is a strategy that needs to be abandoned as soon as possible, as it
no longer attractive and competitive. Stage 5. Analysis of strategic
alternatives
Abel's 3D diagram
Who???
Market segments
What???
Characteristics
needs
How???
Technologies Stage number 6. Choosing an organization strategy
Commission Method
The method of commissions consists in an open discussion on
problem under discussion to develop a consensus
teams, teams, teams. collective opinion
determined as a result of open or secret
voting.
A positive side effect is growth
awareness of the team about the state of affairs of the organization
(institutions).
Side negative effects - manifestation
conformity, the discussion is often only leading experts.
The implementation of the chosen strategy option can
be carried out through a variety of tools, including
traditional:
development program,
annual action plan,
system of tactical tasks,
management
procedures and rules
development and implementation of regulations,
job descriptions,
network work schedules,
guidelines, etc. Stage number 7. Implementation of the strategy
Matrix "Map of key participants"
The degree of influence on
project (support
given person, group)
Vital
needed
Undoubtedly
desirable
Desirable
Attitude to the project
Enthusiast
Neutral
Opponent
Financial
director
Accountant
Parental
Committee
Optional
Different key stakeholders may understand the goals of the project in different ways. Should
agree on the understanding of the goals "before", "in the process" and "after" the implementation of the project.
strategies
Step number 1. - Selection of the leading parameters that determine
state of the institution. For each parameter select
controlled indicator.
As an option - the main sections of the "Public Report
educational institution", which have quantitative parameters.
For example, - "Number of students".
Step number 2. - Fixing the actual achieved for each
controlled outcome. This figure is taken
for the baseline.
"Number of students" - 450 people. Stage 8. Evaluation of the results of implementation
strategies
Achievement Quantification Matrix
strategic goals" - "CODE SC"
Step number 3. - Determining the limit by an expert
possible outcome for each indicator.
These values are evaluated on a discrete scale (up to 10 points).
"Number of students" - initial level - 450 people.
Quantity
students
(pers.)
400
420
440
460
480
500
Discrete
points
1
2
3
4
6
10Stage 8. Evaluation of the results of implementation
strategies
Achievement Quantification Matrix
strategic goals" - "CODE SC"
Step number 4. - Determining the maximum possible (acceptable)
indicator of the deterioration of the situation for each parameter.
For example, - "Number of students" - at least 400.
Step number 5. - Determining the weight of each parameter in points.
1. "Number of students"
5 points
2. "Number of qualified permanent employees"
4 points
3. "Number of available computers"
1 point
4. "The number of high school students who successfully passed the exam"
2 points
5. etc. Stage 8. Evaluation of the results of implementation
strategies
Achievement Quantification Matrix
strategic goals" - "CODE SC"
Step number 6. - Determining the index of controlled indicators
(for each parameter) = score (step #3) x score (step #5).
For example, 4 points (an indicator of the number of students -
460 people) x 5 points (weight of the parameter "Number of students") =
20 points.
It is this index that is the basis for comparison.
planned indicators for all main parameters
strategic plan for the development of an educational institution, in
including comparisons with earlier results his
activities in previous years. Instead of concluding the introductory part:
"Many small successes
are a guarantee of a big win.
We need a system!"
W. Schwebel At the top of the figure is the aggregate consumption curve
traditional resources in the world, which is approaching the point
corresponding to the 20-30s of the XXI century, to the limit line. Thereby
emphasizes that the rapidly growing needs of people,
involved and involved in the consumer society, too much
ahead of the capabilities of mankind and its resource base.
It is concluded that “the unlimited growth of the global economy with
limited resource base is impossible. Modern economy
or must radically reorganize (and this in any case
associated with great shocks and at least a temporary decline), or
reach the limits of its development and enter a period of crisis and disintegration
global economic relations".
The figure shows two possible options development of Western countries in
framework traditional principles. At the same time, as a "social-liberal",
and "neoconservative" variants of strategies turn out to be
unable to go beyond the limit of GDP growth. All the more so
the limit is not reached, according to the forecast, neither "new industrial
society”, nor China. The actual and projected development of the countries of the world at the end of the second and
beginning of the third millennium With regard to Russia, there are three possible
options:
1) the option of following in the wake of the strategies of the West,
which becomes for Russia "the end of history";
2) the option of "great upheavals", which can
take shape in the event of a new social revolution in
country;
3) a variant of the "alternative strategy" appearing in
case of consolidation Russian society around
innovative social programs, formed
based on the true interests of the country. This (third) version of the strategy assumes a conscious orientation of the country
(its leadership, "elite" and the whole society) on innovative type development. Just on
Based on this strategy, the country will be fully equipped to enter the expected new scientific and technological revolution. Although the contours of the new scientific and technological revolution remain largely vague,
only she - with the interested and coordinated actions of all countries of the world -
can give humanity a chance to go beyond the limits outlined for today
traditional economic growth.
Based on the theory of foresight N.D. Kondratiev and the methodology of the integral
macro-forecasting, the Global Forecast "The Future of Civilization" for the period
until 2050, developed by Russian and Kazakh scientists in 2007-2009,
published in 10 parts and presented at the Round Table meeting of the 64th
session of the UN General Assembly October 27, 2009 Forecast evaluates the cluster
global crises (civilizational, energy-ecological, geopolitical and
socio-demographic) of the first quarter of the 21st century. Foresight projects at the national level
Country, name Customer (sponsors), Temporary
project
year of implementation
horizon
Japan
Great Britain,
"Partnership for
progress"
USA,
Ministry
education, culture,
sports, science and
technologies, every five
years since 1971;
last -2005
Office of Science and
technologies, 1995
Method
Main
results
30 years
panels,
Delphi
Reports, lists
development recommendations
thematic areas,
recommendations for scientific
politics
10-20 years
panels,
Delphi
Recommendations for measures
scientific and technical
politicians
critical
technologies
List of critical
Technologies
Panels
List of critical
Technologies
Method
critical
technology,
RK polls
Lists of critical
Technologies
Office of Science and
technologies, 1995
5-10 years
Netherlands,
Ministry
economy, 1998
10 years
USA,
Office of Science and
technologies, 1998
"National
critical
technologies"
"Technological
radar"
"New Forces in
action"
Sweden,
"Swedish
technological
Foresight"
France,
"Critical
technologies, 2005"
1999
2004
2000
5-10 years
Reports by directions
10-20 years
Panels
5-10 years
critical
technologies,
expert
groups, surveys
List of key
technologies A country,
Project name
Customer (sponsors),
year of implementation
Germany,
"Futur"
Ministry
education and science, with
1999
Great Britain,
Office of Science and
technologies, several
ministries,
1999-2002
"Program
Forsyth",
2nd round
Office of Science and
technologies, several
"Program
ministries since 2002
Forsythe, 3rd round
Czech Republic,
Ministry
"Suggestions for
education and science,
national
research
2002
Temporal
horizon
Method
Main
results
20 years
Panels, scripts
10-20 years
panels, seminars,
open discussions,
internet platform
Strategic
development directions,
priorities for
research
programs
Great Britain,
10-20 years
10 years
expert groups,
scripts,
scanning
technologies
critical
technologies
programs"
Offers for
support
national
innovative
systems
Offers for
innovative
development
Suggestions for
national
research
programs
Korea
Ministry of Science and
technologies, 2003
25 years
Analysis
needs,
Delphi, scripts,
benchmarking
Reports, scenarios,
proposals for the 3rd scientific and technical plan
Russia
Ministry
education and science
RF, 2005
10 years
critical
technologies,
expert groups,
expert surveys
Scroll
priority
directions and
critical
technologies CREATIVITY
forsyth diamond
EVIDENCE Today, the Foresight methodology is actively used in
national, supranational, sectoral, regional and
corporate levels. However, the main advantage
this methodology compared to traditional approaches
is a focus on involving all stakeholders
sides, which allows not only to fully take into account all
important aspects of the problems under consideration, but also to find ground
to coordinate positions on finding mutually acceptable
ways to solve them.
Spheres of application of Foresight and range of tasks solved with its
help are very diverse. Already gained a lot of experience
implementation of projects at the national, sectoral,
regional and corporate levels. In recent years, all
more projects are implemented in cooperation with two or more
countries, special programs are being formed within the framework of
international organizations are projects of the so-called
supranational level. At each of these levels, you can
find examples of projects covering a variety of topics
- from predominantly scientific and technological to industrial,
educational, social, environmental, etc. ■ Development of social programs (aging
population, health care, education):
Germany, Japan, Austria, Netherlands
2008
■ Strategic programs for innovative
country development:
Japan, Ireland, Australia
■ Forecasts, scenarios, technological maps
development of economic sectors:
UK, Italy, Canada
■ strengthening the integration of science and education:
EU
■ Development of national (international) scientific and technical programs:
Czech Republic, China, EU
■ Formation of lists of critical technologies:
USA, France, Netherlands
■ Positioning of the country in the global scientific and technological space (benchmarking):
Japan, UK, Germany
1970 Control questions and tasks
1. What are the functions of forecasting in the system of state regulation
socio-economic development? Show on concrete examples, as these
functions are carried out.
2. What are the main provisions of N.D. Kondratiev. To what extent
these provisions are taken into account in modern forecasting practice in Russia and abroad.
abroad?
3. What is the essence of the integral macro forecasting methodology? What are her
advantages over commonly used methods (extrapolations,
foresight, etc.)?
4. What types of cycles need to be considered in the long and medium term
forecasting socio-economic and innovation-technological development?
5. What are the features, advantages and limitations of using the Foresight method in
forecasting?
6. Draw a diagram of summary indicators and balances of macro forecasting and
show the relationship between them.
7. What causes the global energy, environmental, food, financial and economic crises early XXI V.? Identify possible scenarios for overcoming these
crises. What is the role of Russia in the development and implementation of these scenarios? Is it possible to
anticipate a crisis?
Strategic analysis can be carried out both in relation to the organization itself and in relation to other enterprises. Their actions can be analyzed for benefit and harm, their capabilities can be assessed for completeness and emptiness, their plans can be studied in terms of strategy and tactics.
Based on this vision, we can more adequately build our strategy. Thus, strategic analysis is not only the decomposition of a phenomenon into separate components, but also their understanding, comprehension from a certain angle.
Let's consider and analyze the main approaches and directions of strategic analysis in the context of changes and transformations in economic processes.
One of the popular methods of strategic analysis is the method of the Boston Consulting Group, the matrix "growth - share in the market turnover", developed to assist managers of diversified multi-products, multi-markets and multi-national businesses in diagnosing corporate strategy by providing an analytical framework for calculating the optimal product or business portfolio. Many other management tools cannot combine the depth and breadth of information in the way that the growth-to-market share matrix does in one concise document. This simplicity allows the portfolio matrix to be used simply and quickly to identify areas for further in-depth analysis.
Rice. 1.1
Although the growth-to-market share matrix is a conceptual tool that allows you to easily and quickly identify areas for further comparative analysis its main disadvantage is that the relative market share does not allow a correct assessment of the competitive position of the enterprise (that is, there is no clear and definite relationship between market share and the level of income of the enterprise or has grown as a whole).
The second method of strategic analysis is the General Electric business screen matrix (Fig. 1.4) - a descriptive method using an evaluation and regulatory strategy.
It consists of a matrix that combines an internal strengths analysis of an organization with an analysis of the industry's external environment to describe the competitive situation of various strategic organizational units and to guide the allocation of resources between strategic organizational units.
The business screen model offers greater flexibility than the growth-to-market ratio matrix. This is for two reasons: firstly, different variables can be included in the definitions of business stability and industry attractiveness, allowing for a more detailed analysis, and secondly, different weights can be assigned to the selected variables, making the business screen more useful in each unique situation of each strategic organizational unit. disadvantages this method is the exhaustibility of the considered variables chosen to determine the stability of the business and the attractiveness of the industry. Moreover, the choice of significance for each variable is subject to bias and error. The use of return on invested capital as the only benchmark does not fully reflect the performance of an enterprise that competes in the market with other economic entities.
The industry analysis method (the “five forces” model) has become widespread, which offers a structured analysis and overview of any industry (Fig. 1.2)

Rice. 1.2
The purpose of this method is to identify the development potential of the industry. Competitive forces analysis is used to identify the main sources of competitive forces and the corresponding strength of these influences. The use of the "five forces" model will greatly improve the analysis of the component environment in formulating the strategy and its practical application. Home weak side the five forces model is the assumption that economic structure industries are driven by competition. Moreover, this framework is developed to analyze the strategies of only individual organizational units, since synergies and interdependencies of the portfolio of the overall corporate level are not taken into account.
The most popular method of strategic analysis is SWOT analysis or TOWS analysis - this is an abbreviation consisting of the words: " strengths”, “weaknesses”, “opportunities” and “threats”. A SWOT analysis is an analogue of a more detailed situational analysis, used to assess the possible comparison of an organizational strategy, its internal capabilities (namely, strengths and weaknesses) and external conditions (that is, its opportunities and threats).
One of the most important advantages of SWOT analysis is its wide applicability. It can be applied to a wide variety of organizational units, including individual managers or decision makers, teams, projects, products/services, functional areas of an organization (e.g. accounting, marketing, manufacturing and sales), manufacturing units, corporations, conglomerates and product markets. SWOT analysis does not require special financial or computer resources, it can be carried out quickly and with high efficiency without having to collect a lot of data. The SWOT model is clearly a descriptive model that does not provide the analyst with clear and well-articulated strategic recommendations. A SWOT analysis will not provide the decision maker with concrete answers. On the contrary, the method is a way of organizing information and determines the probabilities of potential events - both positive and negative - as a basis for developing business strategy and operational plans. Usually, as a result of the analysis, only too generalized, clearly manifested recommendations are offered: to protect the company from threats, to bring the strengths of the company into line with its capabilities, or to protect the company from weaknesses using methods and methods of protecting property, stimulating the creative activity of the company's personnel, developing innovation activities.
Thus, we believe that in the theory and practice of strategic planning there is no clear classification of methods of strategic analysis and there is no the most optimal one. Moreover, the attribution of a particular method to strategic analysis or strategic choice is most often very conditional, since the methods (models) themselves are quite universal. In strategic analysis, as noted above, the focus is on qualitative, substantive aspects.
Part 1
Master's degree
direction "Management",
program "System Management"
direction "Economics"
program " financial planning and control"
Lecturer - Ph.D. in Economics, Associate Professor Shcherba Tamara Andreevna
Kaliningrad
| Page | ||
| 1. | The concept of strategic analysis. The role of the analytical block in the strategic management system………………………………… | |
| 2. | Analysis of macro-environment factors: PEST-analysis…………………………… | |
| 3. | Modern approach to the analysis sectoral structure and competition. The concept of sustainable competitive advantage…………… | |
| 4. | Analysis of company resources and competencies. SNW analysis……………….. | |
| 5. | Assessment of the strategic type of a company: consumer matrix and producer matrix…………………………………………………….. | |
| 6. | Matrix models of portfolio analysis of diversified companies…………………………………………………………………….. | |
| 7. | Generalizing methods of situational analysis: SWOT analysis, GAP analysis, cost analysis……………………………………………… | |
| 8. | List of basic and additional educational literature……………. | |
| 9. | Practical illustrations……………………………………………… | |
| 10. | Glossary………………………………………………………………… |
Topic № _1__ “__The concept of strategic analysis. The role of the analytical unit in the strategic management system”
Plan:
1. Place of strategic analysis in the system of strategic management
2. The modern concept of strategic analysis
3. Strategic analysis as the basis for the formation of a company's strategy
4. Sources of information for strategic analysis
Study Information on this topic
The strategic management process begins with strategic analysis. Strategic analysis is the basis for assessing the strategic position and the formation of strategic alternatives. The essence of strategic analysis is to identify trends, the nature and dynamics of the external environment, assess the state of the company, assess the state of the company, identify its strengths and weaknesses, assess the degree of impact of risks.
The structure of the basic model of strategic management includes elements of three sections: strategic analysis h, strategic planning, strategy implementation and strategic control
Purpose of strategic management:
- ensuring that the whole company is focused on the key aspect of the strategy: “What are we trying to do and what are we achieving?” , thus defining the vector of development.
- the need for managers to be more responsive to emerging change, new opportunities and threatening trends.
- opportunity for managers to evaluate alternative options capital investments and staff expansion, i.e. wisely transfer resources to strategically sound and high-impact projects.
· the ability to combine the decisions of managers at all levels related to the strategy.
- creating an environment conducive to development and counteracting trends that can only lead to a passive response to changing situations.
The study of different views on the company's strategy made it possible to single out the most preferable one given by M. Porter:
“The essence of strategy is the ability to choose what should be abandoned. If there were no alternative, there would be no need for a strategy. Good idea will be quickly copied by competitors. Again, the profit will depend on the operating efficiency of the company. The choice of strategy comes down to the choice of points of growth and competitive advantage».
The purpose of strategic analysis is an objective assessment of strategic alternatives and the choice of "growth points" based on an analysis of the external and internal environment.
Purpose of strategic analysis- to form a reliable opinion about:
¾ what is the company as an economic entity, how it functions and is managed, what are the results of its activities and how they are formed, what are the strengths and weaknesses in currently time;
¾ what external factors influence the development of the company as a system, what
the mechanism of their impact, how these factors are manifested and measured, what are the trends of their change in the future.
Conceptually, the process of strategic analysis is presented in Figure 1.
Figure 1- Strategic Analysis Process
The initial stage is the formulation of strategic initiatives. Strategic Initiatives are the intentions of the owners and top management regarding the key idea and business model, vision and mission, strategic goals and objectives. In terms of strategic alternatives, owners and managers express their intentions, wishes and requirements for the future state of the company. Strategic initiatives are characterized by:
¾ ambitious ideas;
¾ the scope of activities and structure of the company;
¾ predetermining influence on performance results.
Examples of strategic initiatives include:
¾ changing the key idea of the business;
¾ improvement of the business model;
¾ mergers or acquisitions, sale of part of the business;
¾ attraction strategic partners and etc.
The main stages of strategic analysis:
- Analysis of the internal environment is the process of evaluating a company's performance certain period time in functional areas, the purpose of which is to form a reliable opinion about what the company is, how it functions and is managed, what opportunities and problems it has at the moment.
- Analysis of the external environment- this is the process of determining the state and key factors, identifying trends in their change and assessing the degree of influence on the company's activities, the purpose of which is to identify opportunities and threats from the outside based on an assessment of the competitive and macro environment.
- Analysis of strengths, weaknesses, opportunities and threats– SWOT analysis, the results of which make it possible to form a field of strategic alternatives and evaluate each of them from the standpoint of strengthening the company's competitiveness.
- risk analysis, which is necessary to understand the degree of exposure of the company to the influence of uncertain external factors. Essence this stage analysis consists in identifying risks, determining the factors that cause them, and identifying the likely consequences of their occurrence.
The results of strategic analysis make it possible to form a reliable and full view about what is happening inside and outside the company, about its competitive advantages and disadvantages, about the opportunities and threats of development, the degree of riskiness of strategic alternatives. Each alternative ultimately receives a characteristic in the following aspects:
¾ areas of development: portfolio of strategic business units, product line, target groups clients;
¾ essence of development: business model, business concentration or diversification, competitive advantages, development priorities;
¾ strengths and weaknesses of the company, development opportunities and threats;
¾ sources of development: growth of own and borrowed capital, mergers and acquisitions, strategic alliances, restructuring;
¾ assessment of risks and the degree of their impact on the development of the company;
¾ compliance of the strategic alternative with the strategic initiatives and expectations of owners and managers.
Based on the results of the analysis, decisions can be made on the choice of strategic alternatives, which is the basis of goal setting.
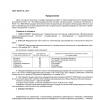
Table 1 presents a matrix of combining strategic analysis techniques with the stages of developing a company's strategy.
Table 1 - The use of strategic analysis techniques in the process of developing a strategy
| Methods of strategic analysis | Stages of strategy development | ||||
| Developing a vision and mission | Development of strategic goals | Choosing a strategy | Implementation of the strategy | Strategy evaluation | |
| PEST analysis | + | + | + | ||
| SWOT analysis | + | + | + | ||
| Industry analysis and competitive analysis | + | + | + | + | + |
| Positional Analysis | + | + | + | + | + |
| Resource analysis (SNW analysis) | + | + | + | + | |
| Strategic cost analysis | + | + | + | ||
| Control system diagnostics | + | + | + | + | |
| Diagnostics org. culture | + | + | + | + | + |
Effective implementation of a strategic analysis of the external and internal environment of the company is impossible without a well-functioning systems information support . In general, information sources are divided into external and internal. TO external sources include legislative and regulations, statistical data, periodicals, economic literature, evaluation of independent experts, market information, etc. TO internal sources include accounting and management accounting and reporting data, constituent documents, technical documentation, audit reports, etc.
A comparative assessment of information sources for strategic analysis is given in Table 2.
Table 2 - Sources of information for strategic analysis
| Information sources | Characteristic |
| 1. Officially disclosed information (annual reports, etc.). | It is one of the most reliable and complete sources. The downside is that only open companies officially disclose information. joint-stock companies, and for analysis small companies will have to find other ways. |
| 2.Official statistics | Government statistics may not contain data on some important market players. Therefore, statistics are useful not so much on their own, but in combination with general market trends and information obtained in other ways. |
| 3. Internal press of the enterprise | Large companies very often post releases on their website corporate newspaper prepared by employees of the enterprise. They rise the most actual problems. Usually they are identified with great difficulty during interviews with leading specialists of the company, but here they are presented in finished form. |
| 4. Publications in the press (analytics, news). | The value of this source is very often underestimated, although sometimes it allows you to find completely closed information. In addition, this source of information is very good for preliminary acquaintance with the situation in the industry and allows you to understand the main specifics of the business, its main problems and trends. |
| 5. Competitors | They are interesting, first of all, for their market assessments, how they position their products, what methods they use to promote them and stimulate sales. Sometimes obtaining information from them in a direct way is impossible, and then various options can be used. Most affordable way- act on behalf of the buyer. Indirect sources of information can be advertising campaigns competitors, information of service, transport companies serving them, etc. |
| 6. Market Experts | In addition to competing companies, there is a huge variety of industry experts: research institutes, various associations, large clients. Their main feature and advantage is that they see the entire situation in the industry, they can clearly grasp common features and trends. |
| 7. Exhibitions | They allow you to quickly establish contact and collect data on the main players in the industry. They are good because in front of your eyes are all the companies of interest at once on one platform. Moreover, they, as a rule, are tuned in to communication, ready to share information. |
| 8. Industry associations, informats. portals | As a rule, they contain information of sufficiently high quality, prepared by specialists, well knowing the features of their industry. This is a good and reliable source of information. |
| 9. Purchase analytics | Various studies are now on the market very widely. Their use is a good alternative to conducting market analysis on your own, but there are a number of significant limitations. When purchasing a study, you need to be sure that it contains the necessary information. Another problem may be the quality of the information available in the report. Try to clarify how you can get answers to these questions before you buy the study. |
Of particular importance among sources of external information are the results of research and forecasts of independent experts specializing in a particular industry.
Questions for self-control
- Determine the place of strategic analysis in the overall system of strategic management.
- What are strategic initiatives?
- What are the stages of strategic analysis?
- What are the main methods of strategic analysis. How do they relate to the stages of strategy development?
- What sources of information do you know for strategic analysis? Describe them.
Economic and mathematical methods and models
UDC 65.012.123
HER. Abushova, S.B. Suloeva
METHODS AND MODELS OF MODERN STRATEGIC ANALYSIS
E.E. Abushova, S.B. Suloeva METHODS AND MODELS OF MODERN STRATEGIC ANALYSIS
The main definitions are considered and methods and models are proposed that can be used in the system of modern strategic analysis.
ENVIRONMENT ANALYSIS; MACRO ENVIRONMENT; MICRO ENVIRONMENT; INTERNAL ENVIRONMENT; STRATEGIC DECISIONS; PORTER MODEL.
In this article the basic definitions are considered and methods and models are proposed that can be used in the system of contemporary strategic analysis.
ANALYSIS OF THE ENVIRONMENT; MACRO ENVIRONMENT; MICRO ENVIRONMENT; INTERNAL ENVIRONMENT; STRATEGIC DECISION; MODEL OF PORTER.
In modern market conditions dynamically changing environment, fierce competition and unpredictability of economic actions of subjects of market relations, the solution of only current problems becomes ineffective for the enterprise. More and more relevant are issues related to the strategic development of the enterprise and the adoption of strategic management decisions. For right choice and making strategic management decisions, developing an effective enterprise strategy and leveling the negative impact of environmental factors, it is necessary to have sufficient “the right information at the right time”. In this regard, the conduct of a strategic analysis is now becoming simply necessary.
With what methods and models is it preferable to conduct a strategic analysis in order to comprehensively assess the factors of the external and internal environment that affect the activities of the enterprise, identify key success factors and adopt effective
management decisions on the choice of strategy - the solution of these issues and ask ourselves in this article.
Review modern methods. Strategic environmental analysis is the initial process of strategic management that provides the basis for defining the mission, goals of the firm and developing strategy. Analysis of the environment involves the study of its three components: macroenvironment, microenvironment and the internal environment of the organization. The analysis of the macro- and microenvironment is aimed at identifying the opportunities and threats of the external environment. The result of the analysis is the identification of key success factors.
Key success factors (KSF) are controlled variables common to all enterprises in the industry, the implementation of which makes it possible to improve the competitive position of the enterprise in the industry. Key success factors may include consumer properties goods, experience and knowledge, competitive opportunities, success in the market, as well as specific areas of the enterprise, allowing it to
successfully compete with competitors and achieve success. In the process of strategic analysis, the KFU of this industry are first identified, after which measures are developed to master the most important of them in order to succeed in this field of activity.
An analysis of the internal environment reveals those opportunities, the potential that a company can count on in the competition in the process of achieving its goals, as well as the weaknesses of the organization. As a result, the main business ability company or its core competencies.
Competence - the properties that all or most enterprises in the industry possess, necessary for participation or survival in it. Competencies include skills, technology, know-how, etc.
Core competence - key properties specific to specific enterprise, unique or at least rare, difficult to copy, which is the main reason for competitive advantage. Unlike physical assets, core competencies are not destroyed when used or shared, but are developed.
Thanks to its core competencies, the company has the ability to produce products that customers value more than competitors' products. This is achieved through better knowledge, possession of information, the availability of skills that surpass the skills of competitors, the use the latest technologies, the presence of appropriate relationships between structural divisions, networks created by the company and gained reputation .
Strategic analysis is expressed in the procedure for searching and selecting strategic alternatives. According to the prevailing ideas, strategic analysis aims to find the most stable patterns and trends in each process that can play a role in the future, and to forecast indicators of production and economic activity based on them. The most important tasks strategic analysis are the justification of the country-
strategic plans, assessment of their expected implementation, as well as providing information for making strategic management decisions.
As a result of the analysis of the activity, the enterprise needs to find out what position it is in, as well as how achievable the strategic goals will be. Because the we are talking O strategic goals, then the focus is on the external conditions of activity, namely, first of all, an analysis is made of the attractiveness of the external environment, the behavior of competitors and consumers.
External review should be performed at the level of the organization as a whole. Carrying out such diagnostics at the highest corporate level not only avoids duplication of work, but also helps ensure that strategic decisions at all levels of the organization are made based on the same vision of the outside world.
Internal strategic analysis should be carried out at the level where control over the resources of the company is exercised, and where decisions are actually made about their effective use.
The main purpose of diagnosing the current situation is to identify constraints and opportunities that need to be taken into account when planning for the future. For this purpose, the analysis of the past situation is of little value. Need information about current moment and about likely changes during the period indicated by the planning horizon. It is also important that the situation is assessed in the context of competitive relations.
The external environment is a set of external subjects and factors that actively influence the position, prospects and effectiveness of the organization. The external environment of the enterprise is usually divided into macro and micro environment.
The macroenvironment includes socio-demographic, technological, economic and political factors. The nature of these factors is such that companies are unable to influence them. There is no need to analyze every facet of the macro environment.
Moreover, it is impossible to do it in full. Therefore, in real life, the area of interest for organizations narrows down to a “meaningful external macro environment”. A meaningful macro environment defines the boundaries of the general environment in terms of analytical purposes. They are based on key aspects that significantly affect a particular organization. Therefore, under the macroenvironment we mean its significant part.
The microenvironment is the environment that directly surrounds the company, i.e. those areas with which the organization interacts or which it itself influences. The microenvironment contains competitors, suppliers, customers of the company, as well as the resources necessary for the successful operation of organizations.
The internal environment of the enterprise - a set of characteristics of the organization and internal actors that affect the position and prospects of the company.
To analyze and predict the development of the macro environment, we recommend using PEST (STEP) - analysis, the purpose of which is to track (monitor) changes in the macro environment in four key areas: P - Political (political and legal), E - Economic (economic), S - Sociocultural (social -cultural), T - Technologcalforces (technological) and identifying trends, events that are not under the control of the enterprise, but that affect the results of strategic decisions.
Caution should be exercised when analyzing the macro environment, as the macro environment is by its very nature a very complex phenomenon. The speed at which changes occur in it is constantly increasing, and changes are turbulent and often unpredictable. Therefore, when analyzing the macro environment, we recommend:
Take into account the limitations and inaccuracies of the analysis;
Conduct analysis on a regular basis;
Constantly update sources of information and improve analysis techniques;
Use information in conjunction with other data.
For the analysis of the microenvironment, the five-factor model of Porter or the resource model is most often used.
At the same time, it should be borne in mind that the resource model is more complex than the Porter model, but it allows you to get a more complete picture of the analysis, understand the nature of competition within the industry and markets, assess the threat posed by competitors operating in other industries, assess your potential for new industries and markets.
The disadvantages of Porter's model include the following:
Internal and external analysis in interaction are not considered;
Companies are assumed to be competitive and non-cooperative;
More attention is paid to the markets for goods and services than to those markets in which the firm acquires resources;
It is not recognized that companies, as a result of their activities, by strengthening their competencies and creating new ones, can change their own competitive environment;
It does not take into account the fact that firms operating outside the industry and market of the organization under consideration can pose a significant competitive threat if they have similar core competencies and distinctive features;
It is not taken into account that strengthening existing and creating new competencies can allow a company to become competitive beyond its own existing markets;
The five factors are assumed to have the same effect on all competitors in the industry. In fact, the strength of the factors is different for different firms. The model implies that if, for example, the possibilities of suppliers are large, then this situation will be true for all firms in the industry. In fact, supplier opportunities may vary for companies in the industry. Large firms will be exposed to less risk from suppliers than smaller ones. Firms with well-known trademarks will be less affected by buyers and substitute products than firms with less well-known brands;
Commodities and resource markets are inadequately described. Purchasing power and supplier power refers to the markets in which firms sell
their goods and receive resources. However, the conditions for both types of markets are somewhat more complex than Porter's model implies.
We recommend that you carry out internal analysis using the value chain according to M. Porter. The value chain is single system basic and auxiliary species activities of an organization that seeks to increase the consumer value of the product and at the same time to reduce its own costs due to the best organization all processes and internal activities at the enterprise. In addition, the value chain also focuses on the processes taking place outside the firm, i.e., each firm is considered in the context of a common chain of activities that create value (value).
1. Analysis of production and economic activities.
2. Analysis property complex enterprises
3. The financial analysis enterprise activities.
Additionally, when analyzing the internal environment of an enterprise, the following methods can be used:
situational analysis;
Desk research (work with accounting documents, statistical and other internal company information);
Observations and surveys of employees of the enterprise using special methods (diagnostic interviews);
Teamwork methods (“brainstorming”, conferences, etc.);
Mathematical methods (trend analysis, factor analysis, calculation of averages, calculation of special coefficients).
One of the main methods used to study the environment and recommended for strategic analysis is SWOT analysis. The informational value of the results of a SWOT analysis depends primarily on the ability of analysts to give the evaluated criteria the right estimates and the creativity of the planning team.
To assess competitive positions, we recommend drawing up maps of strategic groups. A strategic group of competitors is a set of competing firms in a particular industry that have common features. Such features can be similar competition strategies, identical market positions, similar products, distribution channels, service and other elements of marketing.
To summarize the results of the work on the analysis strategic factors macro- and microenvironments, it is recommended to use a special form "Summary of the analysis of external strategic factors" (External Strategic Factors Analysis Summary - EFAS). This form allows not only to reveal threats and opportunities, but to evaluate them in terms of the importance for the organization of taking into account each of the identified threats and opportunities in the strategy of its behavior.
Thus, as a result of solving the problem, those areas of the business and its external environment that are critically important for the implementation of the goals and objectives of the organization are identified. Further, on the basis of the information received, the key success factors and core competencies of the enterprise are identified, since in accordance with them the choice of strategy takes place in the future.
All of the above allows you to get a fairly clear idea of the strengths and weaknesses activities of the enterprise, about the opportunities and threats of the external environment. But in addition to this, in order to obtain a complete picture of the analysis of the enterprise’s activities, as well as for the further development of a strategy, it is necessary to determine not only the identified “symptoms”, but also their sources and specific causes. To do this, we recommend using the "Ishikawa" diagram in combination with "why-analysis" and "how-analysis".
For efficient use this tool we propose to create working group, which will include both managers involved in the development of the strategy, and specialists in strategic management accounting for mutual exchange of information during the "brainstorming". Working with a diagram resembling the skeleton of a fish boils down to the following: the problem to be solved is written on the right, and on the ends of the branches -
specific consequences that the organization faces. To the left, the main groups of causes are distinguished, and even further - the causes themselves that cause the problems under study (Fig. 1). To identify the causes leading to the appearance of the effect, we use the technique of "why - analysis". Its essence lies in the fact that at each stage it is necessary to raise the question "why?" to each factor until the relationship of causes is clarified. Similar to the “why-analysis”, a “how-analysis” is carried out to obtain an appropriate answer to the question of achieving the planned state, which can become a specific recommendation for action. Then, among all the problems, the main ones are singled out, the resolution of which can form the basis of the developed strategy.
When applying the proposed tool, it is impossible to formulate what information is needed, because in each specific case there will be various problems, their causes and, accordingly, various recommendations. However, in our opinion, the information obtained in the course of conducting a strategic analysis of the enterprise's operating environment will be sufficient to use a set of these tools.
Further, we propose to modify the classical Porter model to the model of seven forces of competition (Fig. 2), modified to describe the maximum of parameters acting on the firm in the long run to reflect the relationship between supply and demand.
The elements of the schema are:
1. The fight against direct competitors (or the central ring of competition), the nature of which is determined by the intensity, specific forms competition and the degree of interdependence of rivals.
2. Parameters of demand. Demand is characterized by buyers with a set of benefits and needs. A firm achieves a competitive advantage in demand if it can serve the largest share absolute market potential.
3. Factors of production - labor resources(number, qualification and cost work force), physical resources (quantity, quality, availability and cost of land, forest resources, etc.), climatic resources, geographical position, monetary resources, knowledge resource (the sum of scientific, technical and market information), infrastructure (type, quality of infrastructure available and fees for using it).
4. Technologies and means of production. technological change- the most dynamic of the seven forces of competition, as superior technology over time replaces the dominant technology this moment, and this is the basis for asserting the existence of a product life cycle and competitive advantage due to the emergence, growth, gradual saturation of a derivative need and its decline due to a change in technology.
Consequence Consequence
Rice. 1. Ishikawa Diagram
Threat of lack of consumers
Threat of adverse influence
Influence groups
Technology and means of production
The threat of new technologies
Competitors in the business area
Rivalry between direct competitors
The threat of the emergence of substitute products;
threat of lack of complementary goods
Related and supporting SPs
Rice. 2. Model of the seven forces of competition
5. Potential competitors and their strategies. It is a threat that the firm must strive to reduce and against which it must protect itself by creating barriers to entry.
6. Groups of influence (GV) - contact audiences that can put pressure on the organization both in the direction of expanding activities and changing it, and even force them to abandon it.
7. Related and supporting business zones (ZX) - zones in which firms can interact with each other in the process of forming a value chain, as well as zones dealing with complementary products.
8. Random events - processes that the company's management cannot predict and manage. These are natural changes, force majeure circumstances,
the role of the human factor, unpredictable changes in supply and demand, etc.
Such a scheme is, in our opinion, the most acceptable, since it takes into account all the factors that operate both in the short term and long term and is consistent with generally accepted competition rules. In the short run, it comes down to competition in the field of supply between direct competitors, since the role of supporting and related industries is reduced to the threat of the influence of products and brands of substitutes; the role of production factors is reduced to the threat of losing suppliers or increasing prices for the supplied resources; the influence of the organization on demand is reduced only to pricing policy, technology and means of production, the role of government and GW remain constant; fight against potential competitors
tami comes down only to the establishment of entry barriers to the SZH. Thus, the competitive struggle model is reduced to Porter's simple scheme of industry competition. If we consider competition between countries, then we reach the macroeconomic level, at which the role of the government is only influencing, not decisive, since competition between countries depends primarily on their economic development. The role of technology and means of production can be attributed to random factors, since they are created not by the country, but by the subjects operating within it. As characteristics of other determinants (demand, factors of production, related and supporting industries, competitors and their strategies), aggregated macroeconomic variables are considered. Considering the scheme of the seven forces of competition for an enterprise, the researcher understands the main difficulty in constructing theories of competition, especially in the long run - the close interconnection and interdependence of all components. The scheme of seven forces is a system, the components of which are in numerous connections, partly determined, and partly stochastic.
The choice of strategy is a rather complicated decision, on which the further work of the entire enterprise largely depends. Therefore, as a result of strategic analysis, we must obtain information that is clear, objective, timely and allows not only to choose a strategic alternative, but also to be able to correct it in the future. We propose to use not only separately existing tools, models and methods, but also their combinations. So, we recommend a set of tools for use, which we will call the “matrix kit”.
The algorithm for using the "matrix set" is shown in Fig. 3.
Based on the information obtained during the strategic analysis of the company's activities, we compile the traditional BCG matrix. This requires data on the market growth rate (GRTav), as well as the relative market share (RSH) of each strategic zone host-
vovanie (SZH). For convenience, we depict each SZH as a circle, the diameter of which will be proportional, for example, to revenue. You will get a scatter diagram that will allow you to get a fairly complete picture of the position of the company.
At the second step, we build a modified BCG matrix, which allows, on the one hand, to preserve the main advantages of the traditional model, including simplicity of visual perception and familiar terminology, and on the other hand, to use quantitative information in its construction, which is absolutely always available, accurate, reliable and minimal. by cost, i.e. internal information of the enterprise.
As a characteristic of each product group (horizontal axis of the modified matrix), the parameter K is proposed - “the share of SZH in the total sales of the enterprise” during the base period (the most typical period is 1 year).
As the second characteristic of the product group (the vertical axis of the matrix), the parameter T is proposed - "the share of SZH in the rate of change in the sales volume of the enterprise" during the base period along a linear or any other trend.
The next step is to identify trends in relative market share. This is necessary in order to assess for the considered SBAs in which direction they “move” along the BCG matrix for a more accurate choice of strategy. We propose to break this step into two parts and build two matrices that focus on various factors. Thus, the Growth / Growth matrix focuses on the market and demand, while the value map pays more attention to the analysis of buyers and competitors. In addition, the "Growth / Growth" matrix allows you to identify the trend in the change in the ODR at the present time, and the value map - in the future.
The Growth/Growth matrix compares the growth trends that are observed in the market as a whole with the growth dynamics of the company, the growth in the production of a certain product of the company or a certain SBA.
INFORMATION DATABASE FOR STRATEGIC ANALYSIS
I. Traditional WSO matria
II. Modified matria BSO
SNF, - >7)
[k,™) (kg ]
III.I. Matria "Growth / Growth-
1dr - DRsch / No) if
III, II. value map
VI Complex matrix BCv
Goals, tasks
Choosing a strategic alternative
SZH y * 3 * dug ODR
V. Reflection of cesium, tasks
Current forecast
SZH SNF ODR
IV. Forecast ttdeniy......
Rice. 3. Algorithm for using the matrix kit
To build the matrix, information is required on the market growth rate, on the revenue growth rate (the K parameter is calculated, as when constructing the modified BCG matrix), the size of the SZH area (which was also calculated when constructing the BCG matrices). The result is a picture, analyzing which we can draw the following conclusions:
If the business has grown at a faster rate than the market in recent years, it will be a circle to the lower right of the diagonal line;
If the business grew at the same rate as the market, then the center of the circle would be on the diagonal;
If the business grew more slowly than the market as a whole, then the circles will be located on the left above the diagonal.
where 1dr r is the index of change in market share,
taking into account market influence; GRTg - market growth rate on the z-th SZH.
If the index value is greater than 1, the SBA increases the market share, if the index is less than 1, the SBA loses the market share, if the index is 1, the SBA retains the market share.
As already mentioned, in order to predict the trend of change in the SDR in the future, we have developed a method that should help determine whether it is worth increasing the market share using an aggressive strategy, or on the achieved market share this product should stop and expand only by manufacturing modified products. In other words, is our market share “deserved”, or is our share much smaller?
First, a value map is built to determine a “fair” market share based on data on competitive advantage each z-th SBA at the price (^CP), data on the competitive advantage of each z-th SBA
by quality). The latter may be
found based on the values of the customer satisfaction index (1y k). However, unlike a similar indicator used at the stage of strategic analysis, the index should be interpreted, firstly, for each z-th SBA, and not for the enterprise as a whole, and secondly, when choosing assessment factors, the emphasis should be on the quality .
It is the price and quality criteria that were chosen to build the matrix, since they are the main ones when buying a product. Therefore, in order to determine a fair market share, we must look to the opinion of the buyers so that the assessment is objective and reflects everything that affects the purchase of this product.
A value map is built for each SZH separately. All major competitors must be considered. The indicators of price (Pc) and quality (QC) of all competing enterprises are evaluated on a ten-point scale. Further, SZH of all firms are plotted on the coordinate grid of the graph (Fig. 4). The diagonal line in the figure is the line of correspondence between price and quality.
The niche that we will choose will be limited by the income of the consumer, on the graph this corresponds to the assessment of the price of the goods. The buyer we are considering will definitely not buy cheap goods poor quality or overpriced item. Therefore, all products that fall outside the niche are not considered as competitors, since our consumer will not buy them anyway. In the figure, these are goods B and 0.
In addition, the niche could be limited by the line of technology, since the basis of quality is determined by the manufacturing technology, and it is almost the same for similar products of our companies. Firms with very high technology sell products at a high price that does not correspond to the income of our consumers.
But in this model there is a condition that products with very high quality can be cheap, and therefore there are no restrictions on quality, and all competitors strive for maximum customer satisfaction and minimum prices. They tend to hit some ideal area in the upper left corner.
Quality (OK)
Yainim tknmvgsh 1
1 2 3 4 5 6 / 10 9 in 7 6 5 4
Rice. 4. Value Map
All goods that fall on the same line running parallel to the diagonal are equally competitive.
In order to determine the "fair" market share, let's number the x-axis in reverse order from 10 to 1:
Osh \u003d 11 - Ots,
DRsp IC = DGg
DR£ DRReal
where Оц, is the modified estimate of the price of the product
SZH of the 1st enterprise;
Ots; - evaluation of the price of the SZH product of the th enterprise.
The position of each point (П,) is defined as the sum of the abscissa and ordinate axes:
P \u003d Ok, + ots, \u003d Ok, + (11 - Ots,), (3)
where P, is the position of the SZH of the th enterprise; Ok, - evaluation of the quality of the product SZH, the th enterprise.
Let us determine the “fair” market share of each SZH using the formula
where DR^pr is the "fair" market share of SZH, the th enterprise.
where IdPr is the market share change index, taking into account the influence of customers and competitors; DR™r - "fair" market share £th
SZH enterprises; DRreal - real share
market z-th SZH enterprises.
If the index value is greater than 1, the company will be successful, increasing its market share. Conversely, if the indicator is less than 1, then without targeted actions, the market share of this SBA will tend to decrease.
The next step is to forecast development trends. In other words, on the basis of the identified trends and analysis of the situation, it is necessary to assess how the current situation of the SBA will change without the targeted efforts of the enterprise on them. Forecast of change in market growth rates (OKTau) has already been obtained in the course of strategic analysis
Analytical model of strategic analysis
Stage of strategic analysis Forms of presentation of information Tools used
Collection, accounting and analysis of information about the macro environment Graphs, tables STER-analysis
Collection, accounting and analysis of information about the microenvironment Graphs, tables Resource model, model of the five forces of competition, improved model of the seven forces of competition, "matrix kit"
Collection, accounting and analysis of information about internal environment Graphs, tables Value chain, situational analysis, desk research, etc.
Generalization and comprehensive presentation of analysis information Profile of the enterprise environment, modified profile, map of strategic groups, EBAZ form, matrices of opportunities and threats SWOT analysis, benchmarking, mapping of strategic groups
Identification of the causes of events identified in the previous step Ishikawa diagram Compilation of the Ishikawa diagram
enterprise activities. Also, the trend of changing the market share of SZH for today (1DRg) and in the future (ICRg) was determined. Further based on the forecast
we graphically depict on the BSO matrix the “shift” of the SZH.
Information about goals, quantified in tasks, usually obtained at the goal-setting stage, is reflected in the SSR matrix to visualize “what we want to achieve” for each SBA.
Combining all of the above in one complex SSR matrix, we provide the obtained data to managers for the preliminary selection of strategic alternatives for each SBA.
Using the proposed set of strategic analysis methods will allow you to select preliminary strategies.
In conclusion, summarizing all of the above, we offer in tabular form analytical model strategic analysis, which includes a set of possible forms of information presentation and a set of tools that regulate at what stages of strategic analysis which existing or improved models are recommended to be used.
So, we have considered and proposed for use in the system of strategic analysis various methods and models, both existing and improved and developed by us, that meet the requirements modern conditions activities of enterprises, aimed at solving specific problems of strategic management, providing the ability to adapt the enterprise to changes in the conditions of the external and internal environment.
BIBLIOGRAPHY
1. Aaker D. Strategic market management: Per. from English. / ed. S.G. Bozhuk. 7th ed. St. Petersburg: Piter, 2007. 496 p.
2. Bogdanova T.A. Economic strategy of the firm: textbook. allowance. St. Petersburg: SPbSPU Press, 2006. 130 p.
3. Bowman K. Strategy in practice. St. Petersburg: Piter, 2003. 251 p.
4. Vikhansky O.S. Strategic management: textbook. 2nd ed. M.: Economist, 2004. 296 p.
5. MBA course in strategic management: per. from English. / ed. L. Faeya, R. Randell. Moscow: Alpina Business Books, 2004. 608 p.
6. Campbell D., Stonehouse J., Houston B. Strategic management: textbook: Per. from English. M.: Prospekt, 2003. 336 p.
7. Markova V. D., Kuznetsova S. A. Strategic management. Moscow: Infra-M; Novosibirsk: Siberian Agreement, 2006. 288 p.
8. Strategy. How to create and use an effective strategy / R. Koch. 2nd ed. St. Petersburg: Piter, 2003. 320 p.
9. Thompson A., Strickland A. Strategic management: concepts and situations for analysis: Per. from English. 12th ed. M.: Ed. house "Williams", 2007. 928 a
10. Khorin A.N., Kerimov V.E. Strategic analysis: textbook. allowance. M.: Eksmo, 2006. 288 p.
1. Aaker D. Strategicheskoe rynochnoe upravlenie: per. s engl. Under red. S.G. Bozhuk. 7th ed. SPb.: Piter, 2007. 496 s. (rus)
2. Bogdanova T.A. Economics strategiia firmy: ucheb. posobie. SPb.: Izd-vo SPbGPU, 2006. 130 s. (rus)
3. Bowmen K. Strategies on praktike. SPb.: Piter, 2003. 251 s. (rus)
4. Vikhanskii O.S. Strategicheskoe upravlenie: uchebnik. 2nd ed. M.: Ekonomist", 2004. 296 s. (rus)
5. Kurs MVA for strategic management: per. s engl. Under red. L. Faeia, R. Rendella. M.: Al "pina Biznes Buks, 2004. 608 s. (rus)
6. Kempbel D., Stounkhaus Dzh., Kh "iuston B.
Strategicheskii management: uchebnik: per. s engl. M.: Prospekt, 2003. 336 s. (rus)
7. Markova V.D., Kuznetsova S.A. strategicheskii management. Moscow: Infra-M; Novosibirsk: Sibirskoe soglashenie, 2006. 288 s. (rus)
8. Strategy. Kak sozdavat "i ispol" zovat "effektivnuiu strategiiu. R. Kokh. 2nd izd. SPb.: Piter, 2003. 320 s. (rus)
9. Tompson A., Striklend A. Strategicheskii management: kontseptsii i situatsii dlia analiza: per. s engl. 12th ed. M.: Izd. dom "Vil" iams", 2007. 928 p. (rus)
10. Khorin A.N., Kerimov V.E. Strategicheskii analiz: ucheb. posobie. M.: Eksmo, 2006. 288 s. (rus)
ABUSHOVA Ekaterina Evgenievna - Associate Professor of the Department of Economics and Management in Mechanical Engineering, St. Petersburg State Polytechnic University, Candidate of Economic Sciences, Associate Professor.
195251, st. Politekhnicheskaya, 29, St. Petersburg, Russia. Email: [email protected]
ABUSHOVA Ekaterina E. - St. Petersburg State Polytechnic University.
195251 Politechnicheskaya str. 29.St. Petersburg. Russia. Email: [email protected]
SULOEVA Svetlana Borisovna - Professor of the Department of Economics and Management in Mechanical Engineering, St. Petersburg State Polytechnic University, Doctor of Economics, Professor.
195251, st. Politekhnicheskaya, 29, St. Petersburg, Russia. Email: [email protected]
SULOEVA Svetlana B. - St. Petersburg State Polytechnic University.
195251 Politechnicheskaya str. 29.St. Petersburg. Russia. Email: [email protected]
© St. Petersburg State Polytechnic University, 2014