Pie charts MOBU "Eliseevskaya OOSh" Mathematics teacher Milyutina Irina Anatolyevna Percentage What is a percentage? What fraction is: 100%, 50%, 25%, 75%? Angles How do you build angles? How many degrees is a full circle? How many degrees is the angle? How is a circle built? Diagram - (from the Greek. Image, drawing, drawing) a graphic image that clearly shows the ratio of any quantities. Big encyclopedic dictionary. Air temperature monitoring in Rostov-on-Don for December 2011 Sales, from Sales, from 0 2 and less, 42, to +2, 38, 11% 12% Sales, from + Sales, from 0 2 to +4 , 85, to -2, 85, 24% 24% Sales, +4 to +10, 100, 29% 0 to +2 + 2 to +4 +4 to +10 0 to -2 from - 2 or less Data on the number of students who passed the USE Series1, Chemistry, Series1, 9, 9% Social Science Computer Science, Physics Series1, 11, 11% Social Science Science, 46, 46% Chemistry Series1, Physics, 34, 34% First known pie chart Drawn in 1801 by the famous Scottish economist William Playfair, the founder of graphical methods of statistics. Reading a Pie Chart We intuitively start at the 12 o'clock position and work our way down and clockwise. Magnetic iron ore contains: Series1 , bare rock a, 30, 30% iron Series1 , iron o, 70, 70% iron How to build a diagram? 1. Find 30% of 3600 3600 Solution: 360:100 *30 = 1080 How to build a chart? 2. Draw a circle of arbitrary radius How to build a diagram? 3. We draw two radii at an angle of 1080 1080 How to build a diagram? 4. Fill in the part of the circle outside this corner How to build a diagram? 1. Convert percentages to degrees. 2. Draw a circle of arbitrary radius. 3. Draw two radii at the angle obtained. 4. Paint over part of the circle. Examples of pie charts Examples of pie charts Examples of pie charts Ocean areas Pacific 179 million km2 Atlantic Indian 93 million km2 75 million km2 Arctic 13 million km2 Solution: 1) 179+ 93 + 75 + 13 = 360 2) 360: 360 = 1 ( degree) is equal to 1 million km2 So AOB= 1790, BOC= 930, COD= 750, DOA=130 Ocean areas Pacific Atlantic Indian Arctic Arctic Task 5th grade girls went on an excursion. Before that, they were offered to take one of the fruits in the school cafeteria, to choose from: an orange, a banana, a pear, a kiwi or an apple. The results of their selection are presented in a pie chart. 1. Which fruit was chosen by the most girls? 2. What fruits did the girls choose an equal amount? 3. Which fruit was chosen by the least number of girls? Chart Title pear banana apple kiwi orange Questions What is a pie chart? Give examples where diagrams are used. Why is it called circular? Compare the diagram with the condition of the problem Chart Title A, A, Pa Les shn A, a, z, ... Meadow 3 ... A, a and n ... Others ... 1) Sown areas on Earth Distributed as follows: wheat occupies 30%, corn 16%, barley - 11%, rice - 19% and 24% - other crops. Chart B, Title B, Yach Kukmen uru B,b,… for… Rice, 19, 19% B, Other eB, … Wheat… Chart Title and the World Ocean - 71% in this way: meadows and pastures - 21%, forests - 30%, arable land - 11%, other lands - 38%. One tilt and two tilt! Noisy maple foliage! (Children show and depict the noise of leaves) Build a diagram according to the condition of the problem. In the 5th grade in mathematics, 5 people have time for "5", for "4" - 12, for "3" - 13, there are no losers. 5 4 3 2 Independent work Work according to the Workbook p. 126 No. 1, 2, 3, 4 Questions What new did you learn at the lesson? What have you learned to calculate? How to use the scale to find out whether an image is reduced or enlarged compared to reality. Where in life are diagrams used? Why do you need a pie chart? Homework Read item 43 "Pie charts" Follow the textbook No. 1706, 1707, 1708 Come up with a diagram in Natural History.
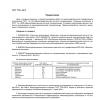
Sown area is a plot of arable land occupied by a variety of crops.
Cultivated areas are distributed (classified) according to various qualitative characteristics: biological characteristics of crops, production purposes, accounting categories, etc.
Depending on the biological characteristics of agricultural crops, all crops are divided into annual, biennial and perennial (permanent) crops. bakura economic cooperative
According to the production purpose, annual and biennial crops, usually placed in crop rotation, are divided into the following groups: cereals and legumes, industrial crops, potatoes and vegetables - gourds, fodder, green manure crops. In turn, these crops are divided into winter and spring crops according to the time of cultivation, and according to the sowing methods - into continuous and tilled crops, coverless and undercover crops. Biological features and a variety of production purposes of agricultural crops are taken into account not only in the process of technology and organization of production, but also form significant differences in statistical information on sown areas, gross harvest and yields by crop groups.
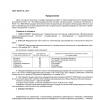
Due to numerous changes over a long period of cultivation, the size of the sown area of agricultural crops is taken into account and specified several times. In this regard, in the statistics of agricultural organizations, the following categories of sown areas are distinguished: seeded sown, spring productivity, harvested and actually harvested areas.
It is customary to call the area seeded on which the seeds of agricultural crops were sown. It can include twice the same area. The double counting of individual areas is due to the fact that the size of the seeded area shows on which area the seeds were re-spent, as well as labor, fuel lubricants for the operation of machinery, etc. At the same time, the seeded area for the crop of the current year and the area seeded in the current year are taken into account separately.
The area seeded for the crop of the current year includes all crops intended for harvesting in the given year, regardless of the timing of seeding. This includes the following types of crops: winter crops of the previous year, reseeding of dead winter crops, spring crops of the current year, coverless crops of perennial grasses of the current year, crops in row-spacing row crops (compacted crops).
The area planted in the current year includes all crops that were sown with seeds in the given year, regardless of the timing of harvesting. It includes: reseeding of dead winter crops, spring crops of the current year, crops of perennial grasses of the current year (cover and non-cover), repeated (stubble) crops, crops in row-spacing row crops (compacted crops), crops for green manure.
The need for statistical accounting of the seeded area in agricultural organizations is caused by constant monitoring of the consumption of seed, as well as labor costs and the cost of fuel and lubricants for sowing.
Spring productive - this is the area occupied by producing crops by the time of the timely completion of spring sowing, from which it is expected to receive the main products in a given year. It includes: crops of winter crops produced in the autumn of the previous year, minus the autumn-winter and spring death; sowings of spring crops of the current year, including re-sowing of dead winter crops with spring crops; coverless crops of perennial grasses of a given year; surviving areas of perennial grasses sown in previous years (cutting area).
The spring productive area, unlike the seeded area, does not include repeated crops of the same areas, therefore, it does not include compacting, stubble, undercover, intermediate crops, since they do not occupy independent areas, as well as green manure crops not intended for obtaining products.
The spring productive area is the main accounting category of sown areas, since data on it are used in determining the gross harvest and crop yields. By the beginning of harvesting, the spring productive area is subject to mandatory clarification, since in the period from the completion of the sowing campaign to the start of timely harvesting, changes in the composition of the sown areas may occur due to the summer death of crops.
The harvest area is the area that has been preserved by the beginning of the harvesting of crops, on which it is supposed to harvest the crop in the current year. The size of the harvested area is calculated by excluding from the spring productive area the summer death of crops and areas not subject to harvesting in the current year (undercover perennial grasses; crops used for grazing), and including areas from which the crop is obtained twice in the current year (repeated, intermediate and inter-row crops). The size of the harvested area makes it possible to determine the need for labor force, equipment, storage facilities, set the timing of harvesting crops.
Actually harvested - this is the entire area on which cleaning work was carried out at the time of the timely completion of the cleaning campaign. It is calculated by subtracting from the harvested area plots where the ripened crop was not harvested for various reasons (meteorological, economic, etc.), and crops planned earlier for harvesting, but used for grazing, plowed for fertilizer, etc. Data on actually harvested areas are used in the analysis of the progress of harvesting and the determination of the final crop yield.
Harvest (gross harvest) is the total volume of production in physical terms, obtained from the entire area of harvested main, repeated and inter-row crops of agricultural crops. The yield, measured in simple absolute units of mass (tons, centners, kilograms, etc.), characterizes the overall scale of production for each individual type of crop production.
Accurate data on the size of the crop (gross harvest) can only be established after harvesting. However, crop information is needed in more early periods, for example, to determine the expected production of crop products, calculate the needs of machinery and vehicles before the start of the cleanup. For this purpose, yield indicators are used for different periods (for example, phases) of plant development and periods of agricultural production.
There are the following yield indicators: species yield; harvest on the vine before the start of timely harvesting; actual harvest; clean harvest.
The specific yield is the estimated expected yield, based on the state of crops at different stages of plant development, which is usually determined by an expert (eye-measuring) method, or by a selective method (by applying meters), taking into account the state of crops: density, development, appearance and others. The definition and evaluation of the species yield are common in economic practice and are aimed at the adoption of operational management decisions in crop production technology.
Standing crop before harvest - actually grown, but not yet harvested crop. Its size can be determined in the following ways:
calculated on the basis of continuous data on actual collection and sample data on losses during harvesting from typical plots;
by imposing meters on crops before harvesting (if conditions permit);
by visual assessment of crops by experienced specialists.
The actual harvest (gross harvest) is the recorded fee for each type of crop production after crops are harvested. The actual yield for a group of grains and leguminous crops can be expressed in terms of the initial credited mass (bunker crop) and in the mass after processing (granary crop); for fiber flax and rapeseed - in bulk after processing, i.e. minus from the initial gross collection of unused waste and shrinkage during the completion of the crop; for other types of crops, the yield is determined by the physical mass of the actually received and credited gross harvest.
The net harvest is the actual harvest (usually after processing) minus the seeds of the respective crop species used for this harvest. The net yield can be calculated for cereals, leguminous crops, flax seeds, rapeseed, and potatoes.
Yield is understood as an indicator that characterizes the average harvest of each type of agricultural product per unit area. In agricultural organizations, it is customary to determine the yield per 1 hectare, in personal subsidiary farms- per 1 are or 1 m 2.
In connection with the differentiation of yield indicators (gross harvest), it is possible to calculate the corresponding yield indicators, i.e. species yield, standing yield before timely harvesting, actual yield, net yield.
slide 2
Diagram - (from the Greek. image, drawing, drawing) a graphic image that clearly shows the ratio of any quantities. You first explain what it is.
slide 3
I understand! A chart is a drawn numerical data, thanks to which one or another object can be compared. How to build a chart? To draw a pie chart, you need to: Draw a circle Calculate the number of percentages Convert them to degrees Construct angles with a protractor Paint the sectors with different colors
slide 4
What are the advantages of charts over tables? What are the disadvantages of charts? Visibility, the ability to compare different values with each other, the ability to present a large amount of information. Approximate values
slide 5
Magnetic iron ore contains 70% pure iron, and the rest of the ore is waste rock. To visualize this situation, draw a circle and paint over 70% of its area, and leave 30% of the area unpainted. Since there are 360° in a circle, we need to find 30% of 360°. To do this, we divide 360 by 100 and multiply the quotient by 30. We get: 360: 100 * 30 = 108. So, we need to draw two radii at an angle of 108 ° and paint over a part of the circle outside this angle. We get a drawing. It is called a pie chart.
slide 6
No. The number of parts in the circle will depend on the condition of the problem. Sometimes, to build a pie chart, you have to break the circle into many parts. So that the circle will always be divided into 2 parts?
Slide 7
An example of a pie chart of ocean areas. The Pacific Ocean has an area of 179 million km2, the Atlantic - 93 million km2, the Indian - 75 million km2, the Arctic - 13 million km2.
Slide 8
Slide 9
Slide 10
There are 30 students in the class: 12 boys and 18 girls. Draw a circle corresponding to the total number of students. 360⁰: 30 = 12⁰ corresponds to 1 student. 12⁰ * 12 = 144⁰ - angle corresponding to the number of boys 360⁰ - 144⁰ =216⁰ - - angle corresponding to the number of girls 144⁰ 216⁰ girls boys
slide 11
Let's solve the problem: Terrestrial lands on Earth are distributed in the following way: meadows and pastures - 21%, forests - 30%, arable land - 11%, other lands - 38%. Solution: 100% - 360⁰ (circle) 1% - 3.6⁰ 21% - 21*3.6⁰= 75.6⁰ 30% - 30*3.6⁰= 108⁰ 11% - 11*3.6⁰= 39.6⁰ 38 % - 38*3.6⁰= 136.8⁰
slide 12
Grasslands and pastures - 75.6⁰ Forests - 108⁰ Arable lands - 39.6⁰ Other lands - 136.8⁰ Other lands 136.8⁰ Forests 108⁰ Grasslands and pastures - 75.6⁰ Arable lands 39.6⁰
slide 13
To solve the problem, draw a circle. Cultivated areas on Earth are distributed as follows: Wheat - 30% Corn - 16% Barley - 11% Rice - 19% Other crops - 24% 30% 16% 11% 19% 24%
Slide 14
Dunno sells newspapers. Monday - 20 Tuesday - 25 Wednesday - 32 Thursday - 30 Friday - 23 Saturday - 30 Sunday - 20. Construct a pie chart "Sale of newspapers"
slide 15
Construct a pie chart "Nutritional norms for girls aged 11-13". Girls 11-13 years old should receive 85g of protein, 85g of fat, 340g of carbohydrates per day.
- Journey through the pages of the dictionary
- Chart examples
- How to draw an angle (review)
- Problem solving
- Tasks for independent solution
- Homework
- Links

You first explain what it is.
Diagram –
(from the Greek. image, drawing, drawing) a graphic image that clearly shows the ratio of any quantities.

I understand! A chart is a drawn numerical data, thanks to which one or another object can be compared.
How to build a diagram?
To draw a pie chart you need:
- draw a circle
- Calculate the percentage
- Convert them to degrees
- Construct angles with a protractor
- Paint sectors with different colors

What are the advantages of charts over tables?
What are the disadvantages of charts?
Visibility, the ability to compare different values with each other, the ability to present a large amount of information.
Approximate values

- Magnetic iron ore contains 70% pure iron, and the rest of the ore is waste rock. To visualize this situation, draw a circle and paint over 70% of its area, and leave 30% of the area unpainted.
- Since there are 360° in a circle, we need to find 30% of 360°. To do this, we divide 360 by 100 and multiply the quotient by 30. We get: 360: 100 * 30 = 108. So, we need to draw two radii at an angle of 108 ° and paint over a part of the circle outside this angle.
- We get a drawing.
He is called pie chart.

So that the circle will always be divided into 2 parts?
- No. The number of parts in the circle will depend on the condition of the problem.
- Sometimes, to build a pie chart, you have to break the circle into many parts.

An example of a pie chart of ocean areas.
- The Pacific Ocean has an area of 179 million km 2 , Atlantic - 93 million km 2 ,
- Indian - 75 million km 2
- Arctic - 13 million km 2 .


There are 30 students in the class:
12 boys and
18 girls.
Draw a circle corresponding to the total number of students.
360⁰: 30 = 12⁰ corresponds to 1 student.
12⁰ * 12 \u003d 144⁰ - the angle corresponding to the number of boys
360⁰ - 144⁰ \u003d 216⁰ - - angle corresponding to the number of girls
boys
girls

Let's solve the problem:
Solution:
Terrestrial lands on Earth are distributed in this way:
100% - 360⁰ (circle)
meadows and pastures - 21%, forests - 30%,
1% - 3.6⁰
arable land - 11%,
21% - 21*3.6⁰= 75.6⁰
other Earths - 38%.
30% - 30*3.6⁰= 108⁰
11% - 11*3.6⁰= 39.6⁰
38% - 38*3.6⁰= 136.8⁰

Meadows and pastures - 75.6⁰
Forests - 108⁰
Arable land - 39.6⁰
other lands - 136.8⁰
Arable land
Meadows and pastures - 75.6⁰
Other lands 136.8⁰
Forests 108⁰

Draw a circle to solve the problem
The sown areas on Earth are distributed as follows:
- Wheat - 30%
- Corn - 16%
- Barley - 11%
- Rice - 19%
- Other crops - 24%

Dunno sells newspapers.
Monday - 20
Tuesday - 25
Wednesday - 32
Thursday - 30
Friday - 23
Saturday - 30
Sunday - 20.
Build a pie chart "Sale of Newspapers"

Build a pie chart
“ Nutritional norms for girls aged 11-13”.
Girls 11-13 years old should receive a day
85g proteins,
85g fat
340g carbohydrates.

Build a pie chart
“ Time distribution by a 5th grade student”
- Sleep - 9 hours.
- Studying at school - 6 hours
- Homework - 2 hours
- Rest - 3 hours
- Work with PC - 0.5 hour
- Watching TV programs - 1.5 hours
Is it possible to build a diagram? What else can you spend time on?

Homework
Build a chart (one of your choice):
- The number of words read per minute (grade 5).
- Number of students by grade (grades 5-8).
- The population of the capitals of the world.
- The population of the countries of the world.
- Life expectancy in different countries.
- Number of migrants in 2005
- The number of lessons in subjects (grade 5 per year).
- Squares of the countries of the world.

Sources
- http:// oldskola1.narod.ru/Nikitin/0013.htm
- http ://vneuroka.ru
- http:// images.yandex.ru/yandsearch
- http:// www.lenagold.ru/fon/clipart/k/kanc.html
- O.Yu.Edush, T.Yu.Ugrovatova
"Tips for every day", M. Vlados, 1999