Nowadays, it is difficult to keep up with the manufacturers of certain products in terms of developing their capabilities, therefore, often using this or that thing, the user does not even know about some functions. The same can be said for software products. Olga Kleptsova, a leading consultant at vdgb CONSULT, talks about useful features included in 1C:Enterprise 8.0 and how they can save time and money.
After almost six months of a year since the purchase of my new car, I was pleasantly surprised to find that it turns out to have a function for heating side-view mirrors, which can greatly facilitate the life of a motorist in frosty weather. Six months later, it turned out quite by accident that my modest urban "hatchback" can (lo and behold!) open the trunk with a special button without unlocking the locks on the other four doors. This is incredibly handy when poking around in the trunk, almost plunging headlong into it, and therefore you can easily miss an intruder next to the driver's door. I continue to make my discoveries to this day, which greatly amuses my friends and acquaintances - more experienced drivers. Another example. I personally know several people who, when buying a mobile phone, did not have a complete understanding of all the functions available in it, and only then discovered what a huge amount of benefits can be obtained from this wonderful blessing of civilization.
What am I leading to? Many years of experience in the field of information technology have allowed me to compile some statistics on how aware software users are about the real possibilities of the software product they use. The statistics are as follows: The vast majority (namely, more than 80%) of companies, when purchasing this or that software, initially have an idea only about the general concept of the solution, at best, they know individual functional blocks (most often this is the functionality for which, the actual product being purchased). Everything else "remains behind the scenes."
Of course, at the stage of choosing software, such an approach is quite justified - after all, you can’t immediately try to embrace the immensity. But the problem is that almost half of the software users fail to completely "declassify" the rich functionality of the system throughout its entire life cycle.
There are plenty of reasons for that - both objective and subjective. Modern ERP systems are not so easy to learn, the price for system flexibility is often its complexity, and key users of the system do not always have the opportunity to take the time to study the documentation or attend training.
As a result, there are situations when, having invested the Nth amount of funds in an information system implementation project, after the completion of the project, the company uses the system's capabilities by far not one hundred percent, but, let's say, sixty percent. What about the other forty? Perhaps it is with their help that the company will be able to obtain the necessary data from the information system that influence the adoption (or non-adoption) of a strategically important decision for the company. The price point here is very high.
Side-view mirrors of the car, not knowing about the button for turning on the heating, I can quite clear the frost with a spatula. If I'm not in a hurry. What if I'm late and I don't have time for extra gestures? And if it’s minus 30 outside, but I still have gloves at home? So it turns out that in a state of deep frostbite, I arrive at work an hour late. Although you could only press one button. But you had to know exactly where to press.
Translating the topic closer to the subject of the article, I will inform you that "buttons where to click" in "1C: Enterprise 8.0." (namely, this system will be discussed today) an incredible amount. The subject of this article is "Management reporting in 1C: Enterprise 8.0. "Enables its author to reveal his knowledge in this area on a whole book scale (and possibly in several volumes). But knowing how difficult it is for key users of the system to find time to read literature (the shortage of time has already been mentioned above, and therefore we will act consistently), today we will choose only one narrow topic for discussion - "Accounts receivable".
Companies that work with their buyers and customers exclusively on advance payment are in the minority in Russia today, and therefore the issue of receivables management is still relevant. What is the total amount of accounts receivable and what did it consist of? How big or small is this figure compared to the previous month, the same period last year? What is the structure of "receivables" by date of occurrence? Which buyers and customers do not pay for our products? What kind of orders (applications), shipments are not paid? What are the reasons for non-payment and when to expect payments? What actions are taken by company employees to recover receivables and how effective are they? Here, perhaps, are those questions that the heads of companies would like to know the answers to.
So, let's see how a company using the 1C:Enterprise 8.0 software system can get answers to the questions posed.
Who are our debtors and how much do they owe us?
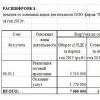
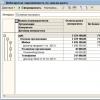
On fig. 1 presents a report that provides information on the amount of debt of counterparties to the company on a certain date (in our example, at the end of the day on July 31), in the selected currency (in our example, it is USD).
The report is detailed by counterparties - buyers and customers of the company.
As can be seen from the report, the total amount of accounts receivable as of 31.07.2005. is 93,310.83 USD. There are 13 counterparties on the list of debtors, and two organizations, Zarya and Iskra, who owe the company much more than the rest of the counterparties, especially "distinguished themselves". This means that it is on these two counterparties that special attention should be paid in the first place.
In cases where the list of debtors does not fit on one page, the report "Accounts receivable - diagram" will help to visually select counterparties with the largest debt

In this case, we have chosen the type of chart - "pie volume", and as data labels - "percentage". The diagram clearly shows that the debts of the two organizations Zarya and Iskra really give together more than 80% (40.81% + 40.93%) of the total amount of receivables, while all other debtors of the company account for only 20%. (This example seems to correspond to the well-known Pareto principle: 20% of buyers - 80% of receivables).
However, in reality, everything is much more interesting. In particular, one of the features is that many companies have several legal entities, and our debtors are no exception. Imagine a small holding company (let's call it "Glavtorg"), consisting of a trading house (LLC "Trading House"), a chain of retail stores (LLC "Network Stores") and a management company (JSC "Glavtorg"). Suppose that each of the legal entities of the holding is a buyer of our products and has receivables. The size of the debt of each of the legal entities of Glavtorg is not so large as to attract our attention. However, in general, the holding may turn out to be quite an impressive figure that deserves to be worked with.
In 1C:Enterprise 8.0, it is possible to specify a parent organization for each counterparty (thus indicating that the counterparty belongs to a holding), and then generate the necessary analytical reporting by holdings. This possibility is shown in Figures 3 and 4.


Thus, having received a report on receivables, grouped by main counterparties, we saw that the debtors Zarya and Iskra really give 80% of the amount, but the rest of the debt is not at all "spread out" among the rest of the counterparties, but falls mainly on the Shopping Center Snowflake. The Snezhinka shopping center, represented by several legal entities, accounts for 13.45% of accounts receivable.
Note that the grouping of information in reports by main counterparties is precisely one of those features of 1C:Enterprise 8.0 that not all users of the system know about.
Is it a lot or a little? Counted, wept...
Having received the amounts of receivables (in general and for each debtor), we will try to draw conclusions regarding these figures. The first thing we need is a comparison with previous periods. Only by analyzing the dynamics of changes in receivables over a certain (preferably long) period of time, we will be able to assess how good or bad the situation is today.
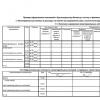
Figure 5 is a report that compares receivables as of three different dates - August 1, 2005, February 1, 2005 (six months ago) and February 1, 2004 (one and a half years ago). The earliest of the three dates - February 1, 2004 - was chosen as the reference period of time (the one with which the comparison of the other two will be carried out). The other two periods are compared with the reference.

The report is generated in the currency of management accounting (in our example - USD) and is detailed by counterparties. Such detailing makes it possible to see the dynamics of changes in the volume of "receivables" over a period of time for each debtor of interest to us separately. In our case, the debtor "Zarya" is alarming, the amount of debt of which has increased dramatically over the past six months. A slight increase in debt (by 21.056% - compared to February last year) is observed with an individual entrepreneur Bobrov A.P. Almost completely (by 99.983%) repaid its debt "Neva TD". The bottom eight lines of the report are counterparties whose debt arose relatively recently - in the period from February to July of the current year, because. neither on February 1 of the current year, nor on February 1 of the last year, "receivables" for them did not exist. This is relatively "fresh" debt.
In general, it follows from the report that over the past year and a half, the volume of receivables from buyers and customers to the company has grown from 13,421.65 USD to 93,310.83 USD. In percentage terms, the growth is 595% (that is, the debt has grown almost 7 times). Is this situation normal? Yes, this situation can be considered normal if during the analyzed period the company's revenue also increased by 7 times. Generally speaking, the volume of receivables is much more interesting to evaluate not in itself, but in relation to the volume of the company's revenue. This indicator is calculated by dividing the amount of receivables at the end of the period by the amount of revenue for the period, and is expressed as a percentage. Let's see what the value of the indicator is in our case. The calculation of the indicator is shown in Figure 6. The value of the indicator is more than 70%. Many companies consider the value of the indicator within 10% to be the norm. From this point of view, our 71.55% is a catastrophic figure, and, of course, the company should take some action aimed at reducing the volume of receivables. And for this it is necessary to understand the reasons for such a volume, and then we will form in "1C:Enterprise 8.0." a number of analytical reports that will help us in this.

But before we go any further, let's go back to Figures 5 and 6 and look at how we were able to get into "1C:Enterprise 8.0." reports of exactly this type (I suspect that this is not obvious for all users of "1C:Enterprise 8.0").
How we got the right numbers in the right form or a few words about the "Budgeting" subsystem
The reports presented in Figures 5 and 6 are actually received from the "Budgeting" subsystem. The subsystem is part of the main solution on the platform "1C:Enterprise 8.0" - "Production Enterprise Management" (abbreviated as "UPP"). The complex solution "UPP" contains several subsystems: production management, sales management, procurement management, cash management, budgeting, personnel management, equipment management, accounting, IFRS. It is not always expedient to implement absolutely all subsystems, and therefore the decision on which SCP capabilities will be used by the company is made individually in each specific case, depending on the specifics of the company's activities and the goals of introducing an information system based on SCP. The decision to implement the "Budgeting" subsystem, as a rule, is made on the basis of the fact that the main feature of the subsystem is budgeting. However, let's see what else the "Budgeting" subsystem can do in terms of generating management reporting. With the help of the subsystem "Budgeting" it is possible to:
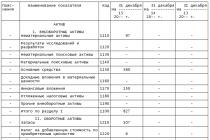
- Form a forecast balance sheet and a number of other forecast forms, taking into account various options (scenarios) for the future financial condition of the company, analyze forecast data (Figure 7),
- Obtain a management balance sheet and other financial statements based on the actual data for the selected period, conduct a financial analysis of the data and compare profits with another period (Figure 7),
- Compare two or more budgets (as a whole and line by line) for different periods of time, compare different options (scenarios) of budgets for the same period,
- Conduct a plan-fact analysis, identify deviations of the fact from the plan (in absolute terms and as a percentage),
- Compare the actual data of several periods,
- Perform the calculation of indicators of an arbitrary type (according to the formulas that the system user sets), based on planned (budget) or actual data.
We used the last two of the listed possibilities to generate the reports we need, presented in Figures 5 and 6.

To obtain data on the amounts of accounts receivable for three different dates and compare the amounts with each other (Figure 5), we used the report of the "Budgeting" subsystem, which is called "Comparative analysis of budgeting account balances". In the settings of the report generation parameters (called by pressing the "settings" button located in the top panel of the report), specify the type of data and dates on the "general" tab as shown in Figure 8.

In order to get details on counterparties-debtors in the report, on the "Groupings" tab, add the "Counterparty" grouping. Having made all the above settings and clicking the "Generate" button, we will receive a report in exactly the same form as in Figure 5. Of course, in the operational contour of the "1C:Enterprise 8.0" system (in particular, in the "sales management" subsystem), you can also get information on receivables, and in a variety of analytical sections. But for a beautiful comparison of data from several periods "with one button", the possibilities provided by the "Budgeting" subsystem are better suited.
Now let's return to Figure 6. The form shown in the figure is also obtained through the "Budgeting" subsystem, and specifically - with the help of the so-called "financial calculations". Financial calculations is a flexible tool in the "1C:Enterprise 8.0" system, which allows the user of the system to build arbitrary financial reports. The user of the system independently sets the structure of the financial calculation - indicates which lines and indicators will be present in the report, and what formulas will be used to calculate the values of these indicators (Figure 9). At the same time, data can be "pulled" into the financial calculation both from the "budgeting" subsystem and from other subsystems - for example, "production management" or "personnel management". The main thing here is to know where to get the necessary data from, and actually writing the formulas is a very simple matter. In our example, we took data from the "budgeting" subsystem, since all actual data (including data on revenue for the period and receivables at the end of the period) in our case are reflected in this subsystem.

Dive into analytics
So, it's time to study the causes of receivables. In order to make assumptions about the reasons for the "receivables", we will try to "twist" these figures in various analytical sections. Only by analyzing the same situation (number, problem) from several different angles, one can draw relatively correct conclusions. From what sides can we look at "receivables" in the information system "1C:Enterprise 8.0"? It can be viewed at least in the following analytical sections:
- For counterparties-debtors (we already did this at the very beginning).
- By intervals of occurrence of debt.
- Under agreements concluded with contractors-debtors.
- By type of contracts.
- By orders (applications).
- By types of orders (applications).
- By types of counterparties (in the context of those types of classifications that are accepted in the company), for example, by geographical regions where counterparties are located.
- For managers who shipped products (goods, services) to counterparties-debtors.
- For the main managers of counterparties-debtors.
- by divisions of the company.
Figure 10 is a report that provides information on accounts receivable by occurrence interval. Let's pay attention to the fact that the values of the intervals (number of days) by which the amounts are grouped in the report are not rigidly set by the program, but are entered directly by the system user. Moreover, you can enter and store several options in the system at the same time, and when generating a report, select the desired option.

This possibility is clearly illustrated in Figure 11 - when generating the report, we introduced a new option for intervals (month, quarter, year, more than a year) and immediately received data on receivables in the context of these terms.

As practice shows, the probability of repayment of the debt by the debtor is the greater, the shorter the period of occurrence of this debt. Of course, there may be exceptions, but in any case, with equal efforts expended by the company to repay the debt, "fresh" debts are usually returned with much greater success.
Let's do a little calculation based on this assumption. Let us estimate the chances of obtaining a debt for a period of not more than 30 days at 90%, from 31 to 90 days - at 80%, from 90 days to 1 year - 60%, and over 1 year - only 20%. The results of the calculation are shown in Figure 12. It follows from them that it is advisable to work first of all with the Iskra counterparty, and secondly with Zorya and Fresh Wind. And it makes sense to simply write off the debt of such organizations as Mir Sveta, Glavspetsstroy and Neva TD. Prioritization is necessary, because the resources that a company can allocate to work with debtors are not endless. (Indeed, all employees of the company from morning to evening cannot deal only with this issue).

The calculation described above and the conclusions that we made on it are just one example of how you can use the reporting generated in 1C:Enterprise 8.0 for analysis and decision making.
The next issue that we will consider is the analysis of receivables in the context of contracts and orders.
Analysis of receivables in the context of contracts and orders (applications) of buyers
Generally speaking, information on receivables in the context of contracts and customer orders in "1C:Enterprise 8.0" can be obtained from several types of reports, namely: "Settlements with counterparties", "Debt by counterparties", "Accounts receivable-diagram", except In addition, some universal shapes will also work. Nevertheless, we will deliberately continue to use only one report "Debts by counterparties", thanks to which we will study the possibilities of the system in terms of various groupings and selections of data. In other words, we will see how, based on the same report template, several different forms can be obtained.
Let's start with the fact that not all information can be included in any report, but only information that meets a certain criterion (or several criteria). What we will do now, having selected in the contract report only those contracts that are concluded with four specific debtor organizations - Zarya, Snezhinka Shopping Center, Fresh Wind and Morozko. To do this, in the conditions for selecting by counterparty (see Figure 13), in the upper part of the report, indicate the type of condition - "In the list" and then add to the list those counterparties that interest us.

Data grouping in reports can be performed both vertically (by rows) and horizontally (by columns) - Figure 14.

In our case, the horizontal grouping is performed by counterparties, and vertically - by counterparty agreements.
Thus, we received a beautiful report on receivables in the context of contracts concluded with buyers and customers.
Now suppose that the company has several types of contracts that differ from each other in terms of payment by the buyer for the shipped products. It would be logical to analyze, and under what types of contracts debt arises more often?
There is such a possibility in the system. Contracts in "1C:Enterprise 8.0" can be divided by types, using, for example, the analytical attribute "Type of mutual settlements" (see Figure 15).

Further, in the "Debt by counterparties" report, it is enough to group the data by this analytical attribute (the grouping setting is shown in Figure 16.), And we will immediately receive an answer to our question.

The report on receivables, grouped by types of contracts, is presented in Figure 17.

What follows from the report? And it follows that the receivables in the company exist only under two types of contracts. The first is contracts that involve payment by the buyer directly upon shipment of products. The second type is contracts, under which payment is made by the buyer once a month on the last day, for products shipped during the month.
At the same time, the debt under the first type of contracts is much larger than under the second. Perhaps the company should revise the terms of the pay-as-you-go contracts, since it is on them that a significant amount of debt arises? And, perhaps, it makes sense not to conclude such agreements at all, but to work with your counterparties on some other terms, thus reducing the likelihood of "receivables" in the future. Although, frankly, looking at our report, it is not at all obvious that the cause of all the troubles lies precisely in the contracts.
In this regard, it makes sense, you can "dig" even deeper and see for which orders (applications) the debt arose. I would like to note that such a possibility exists in the system only if the sign of conducting mutual settlements "on orders" and not "on the contract as a whole" is selected in the contracts.
To obtain information about the "accounts receivable", we will use the same report "Debt of counterparties", but this time in the report settings we will set two groupings by lines - "Counterparty" and "Deal". Under the "transactions" in this case just refers to the orders of buyers. The result is shown in Figure 18.

The counterparty "Morozko" did not pay us for two orders, "Snezhinka" and "Fresh wind" each had one unpaid order. As for the debt of the Iskra counterparty, we, unfortunately, will not be able to detail the orders. It is precisely for the above reason that the agreement with Iskra, under which the debt arose, establishes the sign of conducting mutual settlements "under the agreement as a whole."
Further, it is possible to carry out an even deeper analysis of orders according to various criteria, grouping orders by company departments, responsible employees and any other information that is present in buyers' applications. Or not even present. For example, let's set ourselves the task of finding out whether delays in customer payments are in any way related to the quality of the company's products. To accomplish this task, we propose to do the following: on the basis of a survey of buyers, indicate directly in orders how the buyer evaluates the quality of products shipped on order, and then group all orders for which there is a "receivable" according to these estimates. And then correlate the information received with the amounts of receivables for orders.
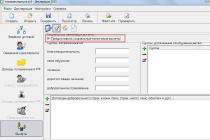
However, when opening the "Buyer's order" document in 1C:Enterprise 8.0, we will not find in it such a field (requisite) in which it would be possible to enter information about the buyer's assessment of the quality of products ordered. Does this mean that our task is impossible? Not at all. In "1C:Enterprise 8.0" it is possible to add to documents (and not only to documents) any additional details called "properties". Taking advantage of this great opportunity, we came up with a new property, which we called "Customers' rating of the quality of products on order" and even set possible values \u200b\u200bfor it "Satisfactory", "Unsatisfactory".

After we indicated in the orders how the buyer evaluates the quality of the shipped products, it became possible to receive a report on receivables of the following form - see Figure 20 (the figure shows both the report itself and its settings in terms of data groupings):

According to the report, buyers' non-payments are unlikely to be caused by complaints about the quality of the company's products. Only in one case (the order for the amount of 1,625.00 USD of the buyer "Morozko") the buyer is clearly not satisfied with the quality of the products, which, of course, may be the reason for the buyer's non-payment of this order. For other orders, such a conclusion cannot be made.
So why don't they pay?
So why don't they pay? You can, of course, interview the debtors themselves, reflect the results of the survey in 1C:Enterprise 8.0, and then build a report on orders, grouped by reasons for delayed payments. For example, in this form (Figure 21):

Of course, it is not always possible to obtain objective data through a survey, but in our example (Figure 21), there is something to think about. In almost half of the cases, debtors cited an agreement to defer payment with a sales manager as the reason for non-payment, while the terms of contracts with buyers did not seem to provide for deferment. A report grouped by the "Responsible" attribute of the "Buyer's Order" document will help you figure out which employees are showing inappropriate initiative (it is assumed that the employee who is indicated as responsible worked with this buyer's request).
A possible version of the report is shown in Figure 22.

Summarizing the above, we note that there are a lot of options for building analytical reporting in 1C:Enterprise 8.0. In our example, we almost all the time worked with a single type of report "Debt of counterparties", and even then we did not exhaust all its possibilities. In "1C:Enterprise 8.0" (if we talk about the complex solution "Manufacturing Enterprise Management") there are more than a hundred types of forms of managerial analytical reporting, in addition, there are several universal forms ("balances and turnovers", "list \ cross-tab", "diagram universal"), as well as a special tool "report console", which allows you to make an arbitrary selection of data from the system. Thanks to this, companies using "1C:Enterprise 8.0" get at their disposal a powerful analytical tool that is useful for all departments of the company. If you learn how to use it correctly. And this is not at all as difficult as it might seem at first glance.
Returning to our example on the topic "accounts receivable", in conclusion we will consider one more small issue. I really want to know when our debtors plan to pay off their debts?
How to get data on planned cash receipts from customers in 1C:Enterprise 8.0
The Cash Management subsystem, which is part of the 1C:Enterprise 8.0. Production Enterprise Management solution, makes it possible to plan cash receipts from customers, reflect actual payments and correlate facts with plans.
Figure 23 shows an example of the Planned Cash Inflows report. The report is built in the context of counterparties. In fact, the presented form is a plan-fact analysis of the receipt of funds from buyers. The "receipt" column contains information about how much we plan to receive from the buyer in this period (in our example, this is the 3rd quarter of 2005). The column "expenditure" reflects the actual receipts of funds from buyers for the same period. In the columns "initial balance" and "end balance" we can see how much of the planned receipts the buyer has left to pay (at the beginning and at the end of the period, respectively, in our example - 07/01/2005 and 09/30/2005). If the columns "initial balance" and "end balance" contain an amount with a minus sign, then it shows how much the actual payment by the buyer exceeded the planned one.

The report "planned cash receipts" can be detailed by customer orders, contracts, divisions, specific dates of planned and actual payments, currencies, types of payments, etc. - the minimum list of possible options is shown in Figure 24.

Thus, having generated the "Planned cash receipts" report, with the necessary analytics and for the required time interval (or at the current time), we will be able to see from whom and for what we expected (or currently expect) cash receipts. Of course, we will receive all this information provided that the planned payments are registered in the information system.
In addition to registering planned payments from buyers in the system, one can also strongly recommend registering events (negotiations) with buyers on the return of receivables. Storing such data in the system will allow, on their basis, to regularly analyze what efforts the company's employees make to return receivables (and by comparing the volume of negotiations and the amount of the debt returned to the company, they will also evaluate the result of these efforts). An example of how negotiations with a debtor can be registered in 1C:Enterprise 8.0 is shown in Figure 25.

Summing up
So, using the example of working with receivables, we got acquainted with some of the capabilities of the 1C:Enterprise 8.0 software system in terms of generating management reporting.
Obviously, this system can really become a real assistant in the daily work of analysts and managers of all levels in a modern Russian company. The construction of management reporting in 1C:Enterprise 8.0 is based on more than a hundred types of report templates covering several contours - production management, equipment, procurement, logistics, inventory management, sales and CRM, personnel management, financial management: budgeting, management accounting , Russian accounting and IFRS. Each of the templates can, in turn, be flexibly customized by the user of the report for specific tasks. However, it is impossible not to notice that such a powerful tool requires adequate efforts to study it, since not all the possibilities of the system are simple and understandable at first sight. To dive into the topic "Management reporting in 1C:Enterprise 8.0", we can recommend attending the seminar of the same name held by the company "vdgb-CONSULT".
The result of the training will be noticeable - the company will discover new opportunities for analyzing its activities, helping to make the necessary management decisions in time. In addition, having studied the software system well, the company provides itself with relative independence from consultants.