Financial analysis is the process of studying the results of an enterprise's activities in order to identify reserves for increasing the value, ensuring further development. Based on the results obtained, management decisions are made, a strategy is developed.
Kinds
There are several ways to study the activity of an enterprise. First, the proportions of reporting items in the final indicator are calculated. Horizontal analysis (temporal) reflects the change in indicators compared to the previous period. Trend comparisons of data with previous periods are carried out in order to form a plan. The coefficients show the ratio of individual balance sheet items, and the reasons for their change are displayed by factor analysis.
The enterprise most often conducts structural dynamic studies and calculates indicators (liquidity, financial stability, profitability, turnover and market activity). This takes into account the following factors:
- the value of the coefficients is influenced by the accounting policy of the organization;
- diversification of activities greatly complicates the analysis of indicators by industry;
- normative and optimal coefficients are different concepts.
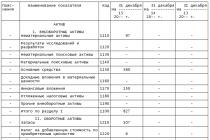
Analysis of balance sheet items shows:
- volume of assets, their ratio, sources of financing;
- which items are changing at a faster rate, and how this affects the structure of the balance sheet;
- share of reserves and DE;
- the amount of own funds, the degree of dependence of the company on borrowed resources;
- distribution of loans by maturity;
- the level of debt to the budget, banks and employees.

Vertical and horizontal balance analysis
The financial statements display the structure of property and sources of its financing. Vertical analysis shows the share of individual balance sheet items. Based on the relative scores, performance comparisons are then made. The calculation algorithm is simple: the share of current non-current assets in the total balance sheet is determined, and then the reasons for their change are analyzed.
Horizontal analysis consists in constructing tables that display the value of liabilities (assets) at the beginning and end of the year in absolute and relative values and their changes. If the calculation period is more than a year, the base growth rate is determined.
These two types of research complement each other. In the vertical analysis, elements with a large specific weight are distinguished, in the horizontal analysis, the emphasis is on spasmodic changes.

Asset dynamics
The balance reflects the property and the sources of its formation. If the currency (total) for the year increases, it is necessary to identify the reasons for the change. The growth of overdue receivables indicates an ill-conceived marketing policy, which can lead to losses. By providing a commercial loan, the company advances its customers, shares part of the income. But if payments from counterparties are delayed, it is forced to take out loans in order to ensure current business activities. If fixed assets are updated, it means that the enterprise is functioning effectively. An increase in the amount of cash indicates an increase in liquidity. Ideally, the money should be enough to pay off 50% of short-term liabilities. The surplus is worth investing.
OA
Current assets may decrease due to a reduction in production capacity, revaluation of fixed assets in accounting records. In other cases, this indicates the formation of a mobile structure of assets, the acceleration of their turnover.

Stocks
The horizontal method of analysis allows you to compare the value of indicators with previous periods. When studying the composition of stocks, attention should be paid to changes in the volume of raw materials, WIP, GP, goods for resale. An increase in the share of reserves may indicate:
- increasing production potential;
- the desire to protect funds from impairment by investing in inventories;
- inefficiency of the strategy, as a result of which most of the OA is immobilized in stocks with low liquidity.
Changes in liabilities
The ratio of own and borrowed capital is also of considerable importance. The greater the share of personal funds, the higher the financial stability of the enterprise, it is less dependent on creditors, it is not threatened with bankruptcy. A significant proportion of borrowed capital indicates a threat. Credits and loans will have to be repaid sooner or later. If the company does not have enough funds, it may go bankrupt. The absence of borrowed funds in general indicates a high financial stability. But it is important to remember that if the profitability exceeds the cost of raising resources, the overall efficiency of the use of funds increases. Retained earnings can also be a source of funding for the organization.

Example
Let's carry out a horizontal analysis of the company's balance sheet. To do this, we calculate the absolute and relative deviations of each reporting item. The horizontal analysis table will help us with this.
| Balance (thousand rubles) | 2013 | 2014 | Absol. | Relative | ||
| working capital | ||||||
| Cash | 17 | 12 | -6 | -33 % | ||
| CB | 54 | 14 | -40 | -74 % | ||
| DZ | 271 | 389 | 118 | 44 % | ||
| Bills received | 47 | 43 | -5 | -10 % | ||
| TMC | 51 | 45 | -6 | -12 % | ||
| Advances | 11 | 10 | -1 | -9 % | ||
| TOTAL OA | 452 | 513 | 61 | 13 % | ||
| OS | ||||||
| Buildings, structures | 350 | 358 | 8 | 2 % | ||
| Depreciation | 84 | 112 | 28 | 34 % | ||
| residual value | 267 | 246 | -20 | -8 % | ||
| Investments | 15 | 15 | 0 | 0 % | ||
| GP | 28 | 28 | 0 | 0 % | ||
| Goodwill | 11 | 6 | -5 | -45 % | ||
| TOTAL OS | 321 | 295 | -25 | -8 % | ||
| ASSETS | 773 | 808 | 35 | 5 % | ||
| Short-term debt | ||||||
| KZ | 143 | 97 | -46 | 32 % | ||
| Promissory notes issued | 38 | 33 | -5 | 13 % | ||
| Accrued liabilities | 55 | 86 | 31 | 56 % | ||
| Loan | 7 | 11 | 4 | 62 % | ||
| Current portion of long-term debt | 5 | 5 | 0 | 0 % | ||
| Debts to the budget | 34 | 35 | 1 | 3 % | ||
| Short-term debt, total | 281 | 267 | -15 | -5 % | ||
| Long-term debt | ||||||
| Bonds payable | 80 | 80 | 0 | 0 % | ||
| Long-term loans | 15 | 10 | -5 | -33 % | ||
| Delayed RPE | 6 | 4 | -1 | -21 % | ||
| Long term debt, total | 101 | 94 | -6 | -6 % | ||
| Equity | ||||||
| Preference shares | 30 | 30 | 0 | 0 % | ||
| Ordinary shares | 288 | 288 | 0 | 0 % | ||
| Additional capital | 12 | 12 | 0 | 0 % | ||
| retained earnings | 61 | 117 | 56 | 93 % | ||
| TOTAL UK | 391 | 447 | 56 | 14 % | ||
| TOTAL Liabilities | 773 | 808 | 35 | 5 % | ||
Horizontal analysis of the asset balance showed that the fixed assets for the reporting period were not updated. The total amount of assets increased by 35 thousand rubles, while liabilities decreased. Changes occurred due to the growth of retained earnings. The amount of working capital increased by 60 thousand rubles. through accounts receivable. Part of the money was used to pay off short-term debt (5.23%). The company compensated for this reduction by increasing liabilities, which in this example were one of the sources of financing. Horizontal financial analysis shows that the ratio of SC to SC is approximately 55:45. A positive trend is a decrease in the share of loans by 5% and long-term loans by 6%. There were no changes in the equity capital structure during the reporting period. Other indicators should be analyzed for more information.
Profit and Loss Statement
For clarity, we decided to use the table again
| Profit Statement | 2013 | 2014 | Absol. | Rel. |
| Revenue | 1230000 | 1440000 | 210000 | 17 % |
| Cost price | 918,257 | 1106,818 | 188,6 | 21 % |
| Material costs | 525,875 | 654,116 | 128,2 | 24 % |
| Salary | 184,5 | 201,6 | 17,1 | 9 % |
| Production costs | 167,05 | 214,12 | 47,1 | 28 % |
| Depreciation of tangible assets | 35,832 | 31,982 | -3,9 | -11 % |
| Depreciation of intangible assets | 5 | 5 | 0,0 | 0 % |
| Gross profit | 311,744 | 333,182 | 21,4 | 7 % |
| Administrative costs | 55,35 | 86,4 | 31,1 | 56 % |
| marketing costs | 129,15 | 122,4 | -6,8 | -5 % |
| Operating profit | 127,244 | 124,382 | -2,9 | -2 % |
| Result from the sale of assets | 1,25 | 6,15 | 4,9 | 392 % |
| Dividends | 500 | 1520 | 1020,0 | 204 % |
| Profit before payment % | 128,994 | 132,052 | 3,1 | 2 % |
| % on bonds | 11,2 | 11,2 | 0,0 | 0 % |
| % on long-term debt | 3,2 | 2,4 | -0,8 | -25 % |
| % on loan | 1,08 | 1,56 | 0,5 | 44 % |
| Profit before tax | 113,5 | 116,9 | 3,4 | 3 % |
| NPP | 34,1 | 35,1 | 1,0 | 3 % |
| state of emergency | 79,4 | 81,8 | 2,4 | 3 % |
A horizontal analysis of the income statement shows that revenue increased by 17% for the year, while gross income only increased by 7%. The undesirable change was due to higher rates of material costs (24%) and production costs (28%). Operating income decreased by 2% due to a significant (56%) increase in administrative costs. Despite the increase in costs, net income increased by almost 3% due to a decrease in interest payments and an increase in profit from non-core activities (sales of assets).

What else to pay attention to
Horizontal analysis, an example of which was presented earlier, allows you to draw general conclusions about the financial condition of the organization. In order to correctly determine the reasons for the change in the structure of assets, it is necessary to additionally investigate form No. 5. An increase in such an article as “WIP” in intangible assets indicates the diversion of resources to unfinished construction objects. This negatively affects the current position of the organization. The presence of long-term financial investments indicates the intensification of investment activity. The liquidity, profitability and risk of issuing securities should be additionally assessed.

The presence in the first section of the balance of patents and licenses indirectly reflects the financing of intellectual property. A detailed analysis of the use of intangible assets is important for management. It cannot be carried out according to the data of the balance sheet alone. Other types of reporting should be additionally involved.